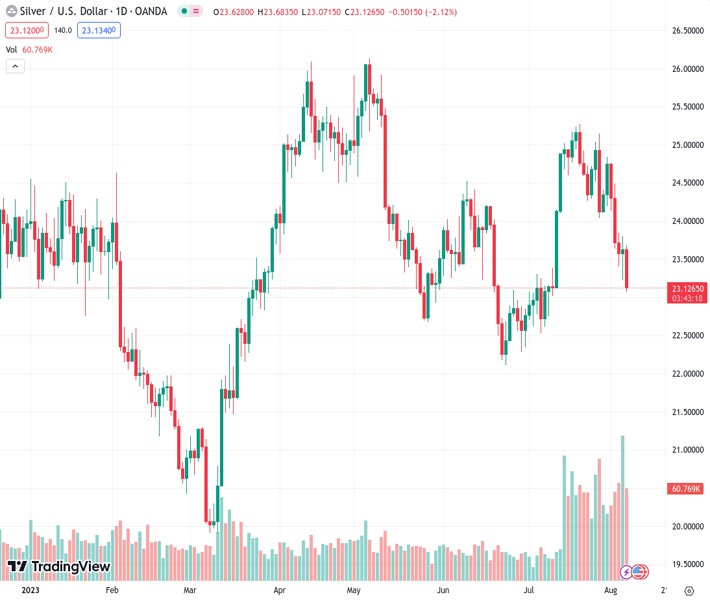
The XAGUSD pair, currently at 23.124, has declined significantly and reached its lowest point since July, around the $23.10 range. It has fallen below the 100-day Simple Moving Average (SMA).
…
This is a premium post.
[s2If !current_user_can(access_s2member_level4)]Please register for FREE REGISTER to read full post below containing analysis. In case of any error or you think you are not able to read the full post below, please email us at support#nehcap.com [lwa][/s2If] [s2If current_user_can(access_s2member_level1)]
- XAG/USD dropped to its lowest level since mid-July, near the $23.10 area, below the 100-day SMA.
The pair currently trades last at 23.124.
The previous day high was 23.8 while the previous day low was 23.23. The daily 38.2% Fib levels comes at 23.58, expected to provide resistance. Similarly, the daily 61.8% fib level is at 23.44, expected to provide resistance.
On Monday, the XAG/USD Silver spot price tumbled near the 100-day Simple Moving Average near the $23.20 area seeing more than 1.80% losses. Rising US yields and a stronger USD following Friday’s sell-off are mainly responsibles for the metal’s decline.
As the focus turns to the next set of inflation data from the US, markets continue to digest Friday’s Nonfarm Payrolls (NFP) report. Job creation cooled down, and wages increased, but the investors dumping the US Dollar during Friday’s session indicated that investors weighted more the decrease in the number of people employed. Still, the Federal Reserve (Fed) will consider rising wage inflation in their next meetings. For the rest of the week, the highlight is the release of inflation data on Thursday, with the Headline Consumer Price Index (CPI) index expected to accelerate to 3.3% YoY and the Core CPI, which is seen falling to 4.7% in the same month.
In response, the US bond yields are edging lower. The 10-year bond yield stands at 4.08%, up by 1.04 % on the day. The 2-year yield stands neutral at 4.77%, and the 5-year yield is at 4.16% with 0.61 % gains.
Regarding the following Fed decisions, according to the CME FedWatch tool, markets discount higher odds of a pause in September with low odds of 20% of a 25 basis point (bps). Those probabilities rise to 30% in November, where the stronger case is also no-hike by the Fed.
Based on the daily chart, the XAG/USD exhibits a bearish outlook for the short term. Both Relative Strength Index (RSI) and Moving Average Convergence Divergence (MACD) remain in negative territory, with the RSI below its midline and showing a southward slope. The MACD is also displaying red bars, indicating a strengthening bearish momentum. Plus, the pair is below the 20,100 and 200-day Simple Moving Averages (SMAs), pointing towards the prevailing strength of the bears in the larger context and the buyers facing a challenging situation.
Support levels: $23.00, $22.90, $22.70.
Resistance levels: $23.20 (200-day SMA), $23.50, $23.70.
Technical Levels: Supports and Resistances
XAGUSD currently trading at 23.12 at the time of writing. Pair opened at 23.63 and is trading with a change of -2.16 % .
| Overview | Overview.1 | |
|---|---|---|
| 0 | Today last price | 23.12 |
| 1 | Today Daily Change | -0.51 |
| 2 | Today Daily Change % | -2.16 |
| 3 | Today daily open | 23.63 |
The pair remains strongly bearish on the daily time frame. It trades below the 20 SMA @ 24.35, 50 SMA 23.73, 100 SMA @ 24.05 and 200 SMA @ 23.17.
| Trends | Trends.1 | |
|---|---|---|
| 0 | Daily SMA20 | 24.35 |
| 1 | Daily SMA50 | 23.73 |
| 2 | Daily SMA100 | 24.05 |
| 3 | Daily SMA200 | 23.17 |
The previous day high was 23.8 while the previous day low was 23.23. The daily 38.2% Fib levels comes at 23.58, expected to provide resistance. Similarly, the daily 61.8% fib level is at 23.44, expected to provide resistance.
Note the levels of interest below:
- Pivot support is noted at 23.3, 22.98, 22.73
- Pivot resistance is noted at 23.87, 24.12, 24.44
| Levels | Levels.1 |
|---|---|
| Previous Daily High | 23.80 |
| Previous Daily Low | 23.23 |
| Previous Weekly High | 24.84 |
| Previous Weekly Low | 23.23 |
| Previous Monthly High | 25.27 |
| Previous Monthly Low | 22.52 |
| Daily Fibonacci 38.2% | 23.58 |
| Daily Fibonacci 61.8% | 23.44 |
| Daily Pivot Point S1 | 23.30 |
| Daily Pivot Point S2 | 22.98 |
| Daily Pivot Point S3 | 22.73 |
| Daily Pivot Point R1 | 23.87 |
| Daily Pivot Point R2 | 24.12 |
| Daily Pivot Point R3 | 24.44 |
[/s2If]
Download Nehcap EAWe have two EAs that are operational on our LIVE accounts.
- EA-FIX: Check out the details here. Download EA-FIX . EA-FIX is a non-grid HFT scalper.
- EA-GROWTH: High quality low dd EA using trend grids. Download EA_GROWTHJoin Our Telegram Group


