This client education note is part of an eight-phase framework for understanding indicators and price patterns. It is designed to help investors read charts with more structure, discipline, and risk awareness.
Executive Context
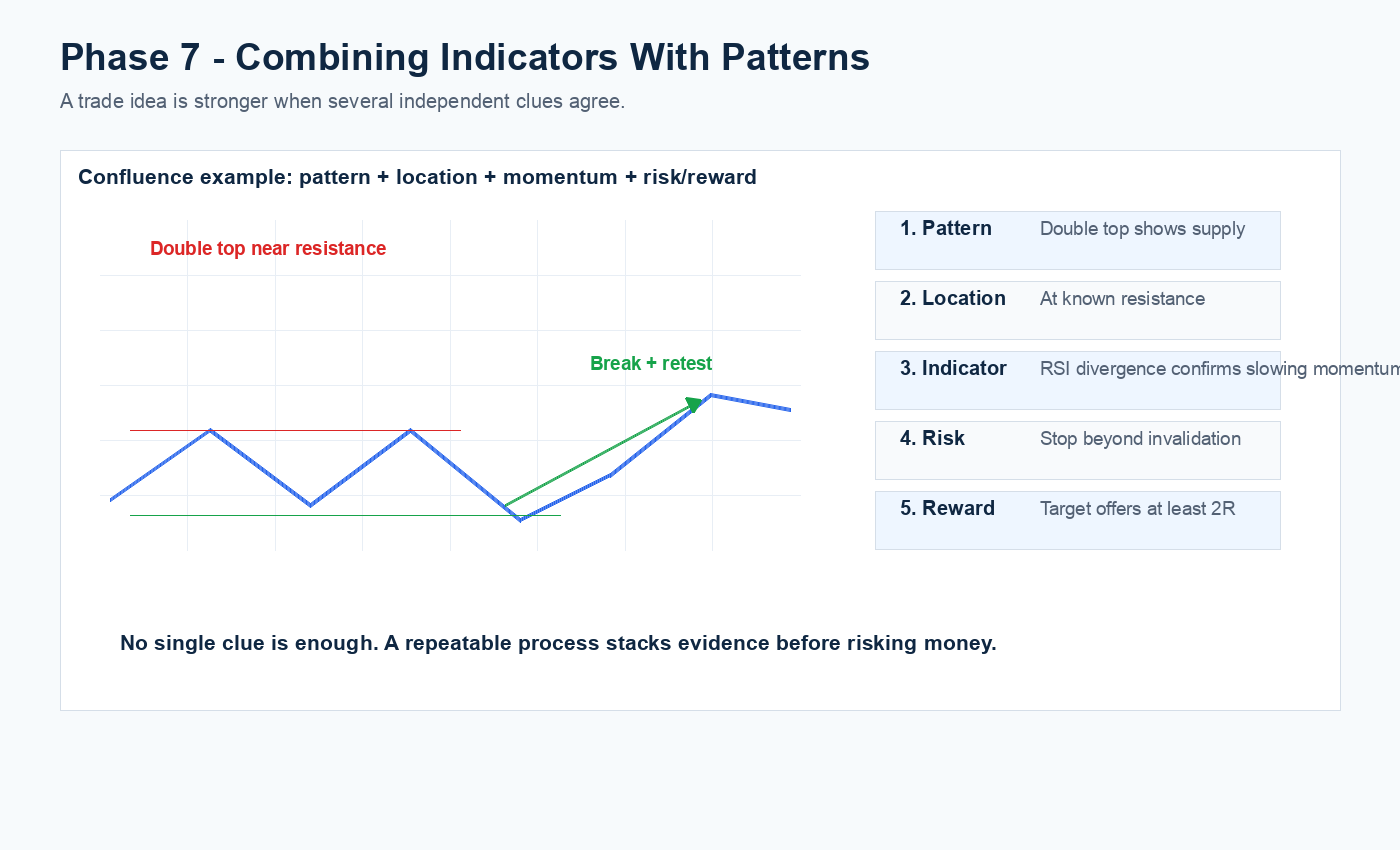
Confluence means multiple independent observations point toward the same conclusion. It is not the same as adding more indicators. In fact, too many similar indicators can create false confidence because they are often measuring the same price data.
A professional framework combines different categories of evidence: structure, pattern, momentum, volatility, and risk. Each should contribute a different piece of information.
A Practical Confluence Stack
- Structure: define whether the market is trending, ranging, or transitioning.
- Level: identify the price area where the decision matters.
- Pattern or candle: observe whether price behavior confirms the level.
- Indicator: use one or two tools to validate momentum or regime.
- Risk: define invalidation, position size, and target before entry.
Beginner Example
A cleaner setup might be: EURUSD is in an uptrend, price pulls back to support, a rejection candle forms, RSI holds above its prior low, and the stop can sit below the structure with a sensible target. That is a structured case. Adding five more oscillators would not necessarily improve it.
Client Takeaway
The best technical process is selective. It looks for agreement across different forms of evidence while avoiding unnecessary complexity.
This material is provided for education and market understanding only. It is not personal investment advice, a recommendation to trade, or a guarantee of future performance.
Previous: Phase 6 – Volatility and Participation | Next: Phase 8 – Repeatable Investment Checklist
NEHCap System Highlight
We run three brilliant specialist systems: HFT_FIX, a FIX-engine high-frequency FX model built for execution speed; NEDEX, an arbitrage framework designed to capture short-lived pricing inefficiencies; and CREST, a high-speed support/resistance trend system focused on fast structural shifts.
Together, they give clients three distinct research engines: speed, arbitrage intelligence, and structure-led trend participation.
HFT_FIX live account: View verified FXBlue tracking
Contact: Contact NEHCap | Telegram: @mqlnehcap | t.me/nehcapmeta
Past performance is not a guarantee of future results. Trading involves risk and should be assessed against each client's objectives and tolerance.


