This research note forms part of an eight-phase technical analysis framework for investors. It is designed to strengthen market interpretation, process discipline, and risk awareness before indicators are used as confirmation tools.
Executive Context
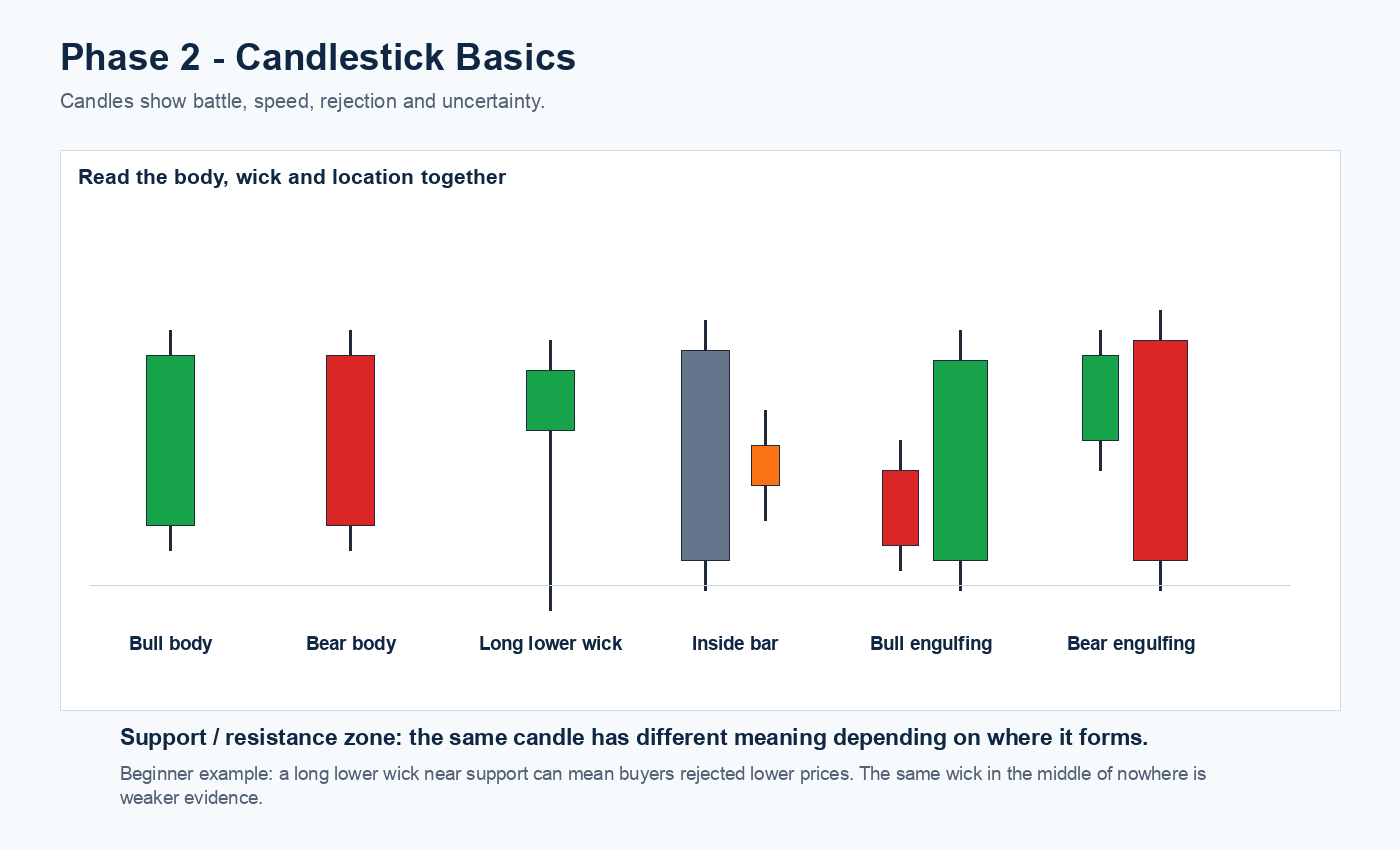
Candlesticks compress a large amount of market information into a simple visual format. The body shows the distance between open and close. The wick shows where price traded but could not hold. A candle is therefore not just a shape; it is a record of participation, rejection, and short-term pressure.
Professional analysis avoids treating single candles as stand-alone signals. A candle at random is noise. A candle at a key level, inside a known trend, and aligned with risk control becomes information.
How To Read The Candle
- Large body: stronger directional participation during that period.
- Long upper wick: buyers pushed price higher but sellers rejected the advance.
- Long lower wick: sellers pushed price lower but buyers absorbed supply.
- Small body: indecision or transition, especially near major levels.
Applied Market Scenario
Suppose XAUUSD falls into a prior support zone and prints a candle with a long lower wick. The institutional interpretation is not an automatic buy signal; it is evidence that buyers defended the level during that period. Confirmation should come from subsequent price action, higher closes, and a clearly defined risk point.
Client Takeaway
Candlesticks are most valuable when they confirm a level or structure that was identified in advance. They are evidence, not a complete investment process by themselves.
This material is provided for education and market understanding only. It is not personal investment advice, a recommendation to trade, or a guarantee of future performance.
NEHCap System Highlight
HFT_FIX is our FIX-engine high-frequency FX model; NEDEX is an arbitrage framework for short-lived pricing inefficiencies; and CREST is a fast support/resistance trend system built for rapid structural shifts.
NEDEX and CREST can run across MT4, MT5, and FIX API environments, depending on broker infrastructure and deployment requirements.
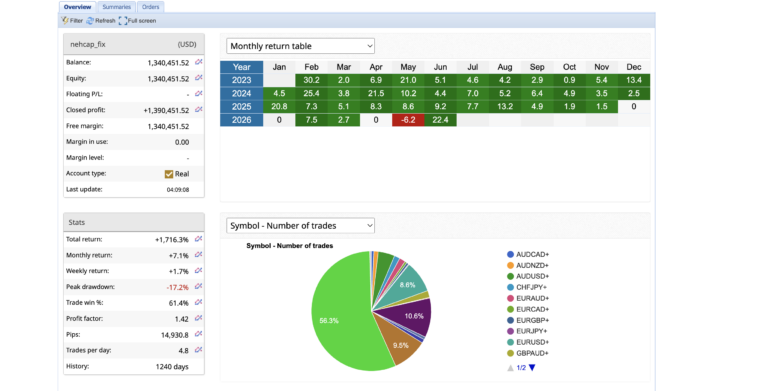
Live HFT_FIX tracking: View FXBlue account
System details: HFT_FIX | NEDEX | CREST
Contact: NEHCap contact | @mqlnehcap | t.me/nehcapmeta
Past performance is not a guarantee of future results. Trading involves risk.


