This client education note is part of an eight-phase framework for understanding indicators and price patterns. It is designed to help investors read charts with more structure, discipline, and risk awareness.
Executive Context
Momentum indicators help assess whether a move is strengthening or fading. They are especially useful when price appears extended, when a breakout needs confirmation, or when a trend is losing internal pressure.
The investor-grade approach is to use momentum as secondary evidence. Price structure defines the trade idea; momentum helps determine whether the idea has sufficient participation.
Common Momentum Tools
- RSI: highlights the strength of recent gains versus recent losses.
- MACD: compares moving averages to show shifts in momentum and trend pressure.
- Stochastic: compares the close with the recent range, often useful in slower or range-bound markets.
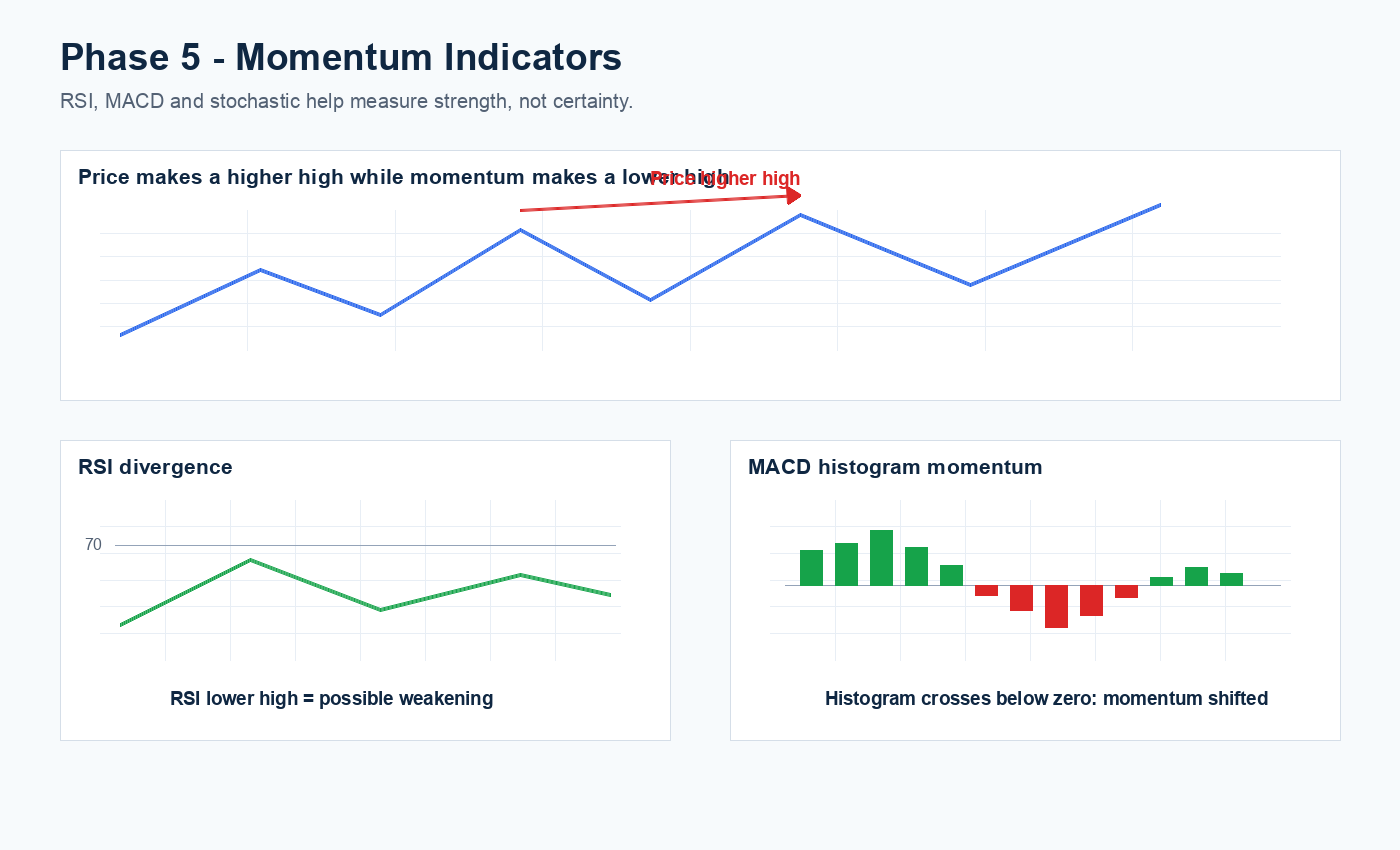
- Divergence: occurs when price makes a new extreme but momentum does not confirm it.
Beginner Example
If AUDUSD makes a new high but RSI forms a lower high, momentum is not confirming price. That does not automatically mean the market will reverse. It means the investor should be more selective, wait for price confirmation, and avoid assuming the breakout is automatically strong.
Client Takeaway
Momentum indicators are confirmation tools. They help grade the quality of a setup, but they should not be used as isolated buy or sell commands.
This material is provided for education and market understanding only. It is not personal investment advice, a recommendation to trade, or a guarantee of future performance.
Previous: Phase 4 – Moving Average Regime Filters | Next: Phase 6 – Volatility and Participation
NEHCap System Highlight
We run three brilliant specialist systems: HFT_FIX, a FIX-engine high-frequency FX model built for execution speed; NEDEX, an arbitrage framework designed to capture short-lived pricing inefficiencies; and CREST, a high-speed support/resistance trend system focused on fast structural shifts.
Together, they give clients three distinct research engines: speed, arbitrage intelligence, and structure-led trend participation.
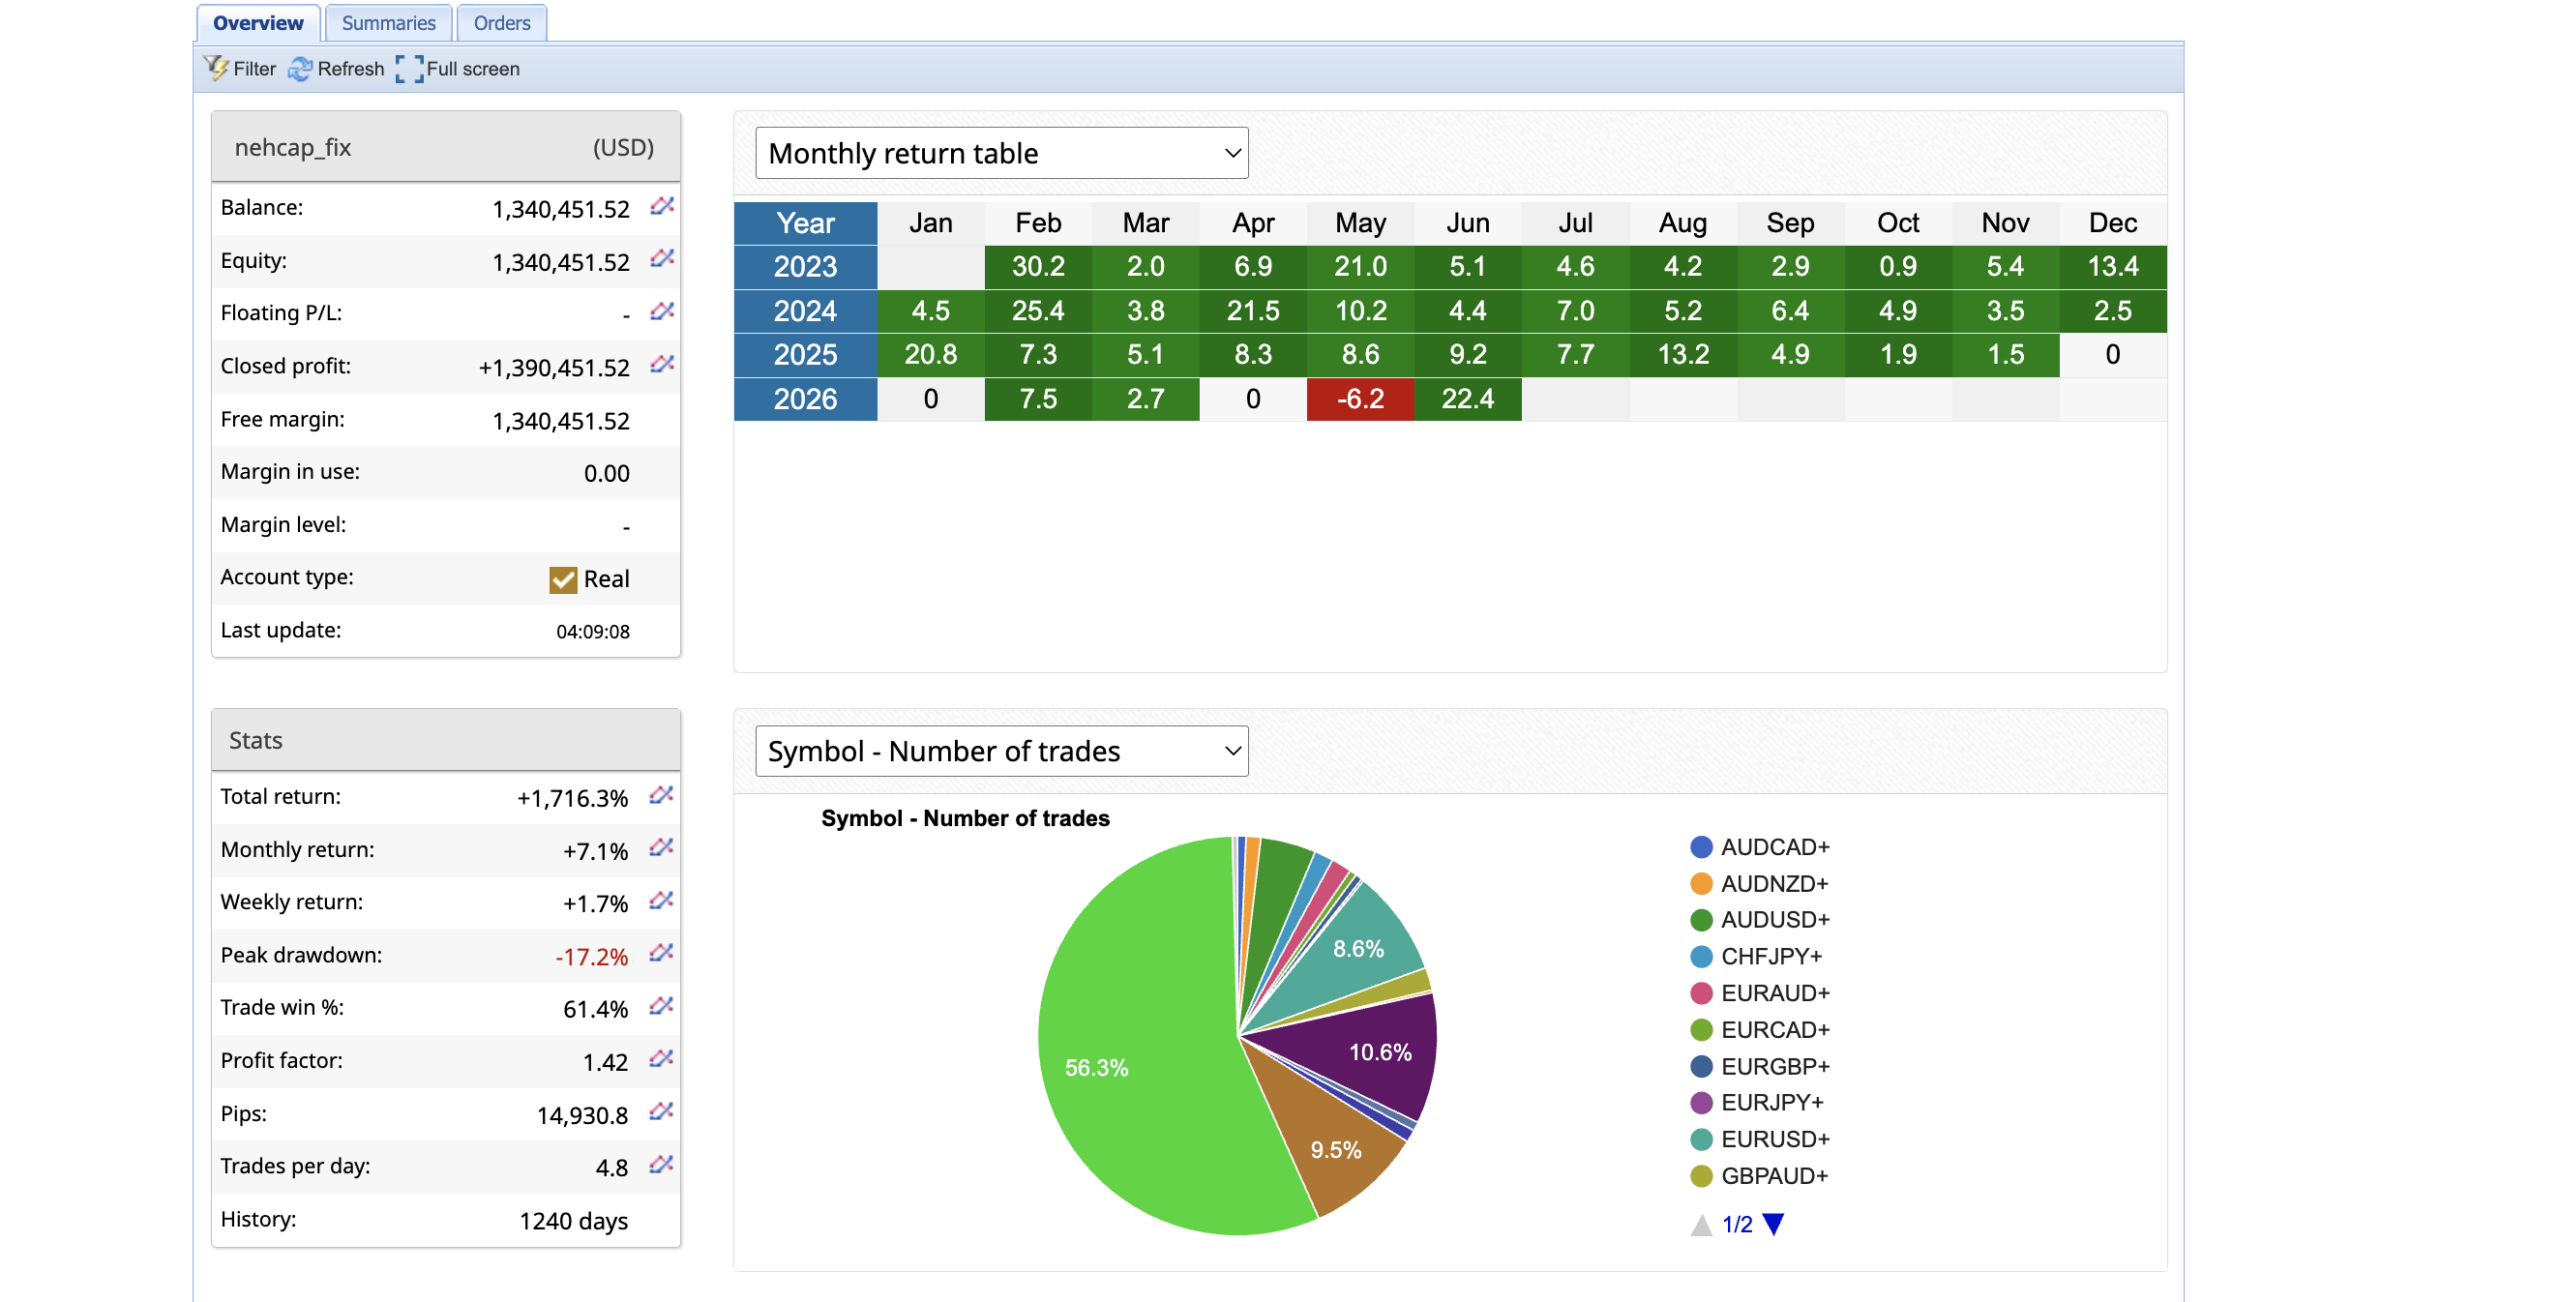
HFT_FIX live account: View verified FXBlue tracking
Contact: Contact NEHCap | Telegram: @mqlnehcap | t.me/nehcapmeta
Past performance is not a guarantee of future results. Trading involves risk and should be assessed against each client's objectives and tolerance.


