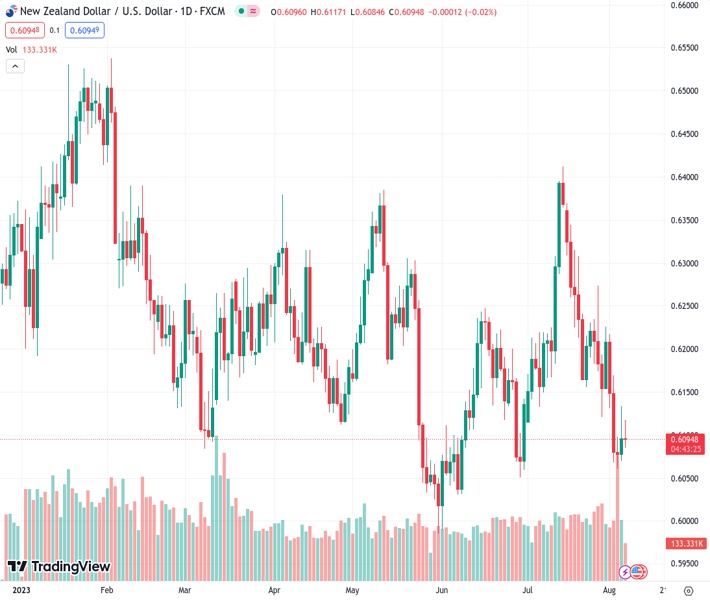
The NZDUSD currency pair is currently experiencing slight growth, slightly above its initial price at around 0.6095.
…
This is a premium post.
[s2If !current_user_can(access_s2member_level4)]Please register for FREE REGISTER to read full post below containing analysis. In case of any error or you think you are not able to read the full post below, please email us at support#nehcap.com [lwa][/s2If] [s2If current_user_can(access_s2member_level1)]
- NZD/USD trades with mild gains, just above its opening price of around 0.6095.
The pair currently trades last at 0.60956.
The previous day high was 0.6133 while the previous day low was 0.607. The daily 38.2% Fib levels comes at 0.6109, expected to provide resistance. Similarly, the daily 61.8% fib level is at 0.6094, expected to provide support.
The NZD/USD traded neutral on Monday, below the 0.6100 level. On the one hand, the USD recovered from rising yields after Friday’s losses, while the NZD trades strong ahead of key Trade Balance data from China on Tuesday.
Markets continue to asses jobs reports from the US released on Friday. Nonfarm Payrolls (NFP) cooled down, leading to a USD sell-off and a decline in US bond yields. It is intriguing why markets disregarded the rise in Average Hourly Earnings so quickly, which may contribute to inflationary pressures. The week’s highlight is the release of inflation data from the US on Thursday, with the headline figure expected to increase to 3.3% (YoY) from the previous 3% in June while the Core measure to decrease to 4.7% YoY from 4.8%.
As a reaction, the US bond yields are showing a mixed performance. The 10-year bond yield trades at 4.09%, seeing 0.79 % gains on the day, while the 2-year yield stands with mild payments at 4.77% and the 5-year yields at 4.17%, seeing a 0.70 % increase, respectively.
As for now, according to the CME FedWatch tool, the odds of a 25 basis point hike remain low for the following September meeting they top out near 30% for the November decision.
On the Kiwi’s side, New Zealand’s economic calendar won’t reveal any high-tier data this week. The highlight will be Chinese data to be reported on the early Asian session on Tuesday, which will impact the Asian block currency depending on its outcome.
Upon analysing the daily chart, a neutral to bearish trend becomes evident for NZD/USD, with the bears gradually taking control. The Relative Strength Index (RSI) turned flat in negative territory, while the Moving Average Convergence (MACD) shows red bars. Additionally, the pair is below the 20,100 and 200-day Simple Moving Averages (SMAs), pointing towards the prevailing strength of the bears in the larger context and the buyers facing a challenging situation.
Support levels: 0.6080, 0.6060, 0.6050.
Resistance levels: 0.6100, 0.6130, 0.6150.
Technical Levels: Supports and Resistances
NZDUSD currently trading at 0.6097 at the time of writing. Pair opened at 0.6084 and is trading with a change of 0.21 % .
| Overview | Overview.1 | |
|---|---|---|
| 0 | Today last price | 0.6097 |
| 1 | Today Daily Change | 0.0013 |
| 2 | Today Daily Change % | 0.2100 |
| 3 | Today daily open | 0.6084 |
The pair remains strongly bearish on the daily time frame. It trades below the 20 SMA @ 0.6215, 50 SMA 0.6165, 100 SMA @ 0.6193 and 200 SMA @ 0.6228.
| Trends | Trends.1 | |
|---|---|---|
| 0 | Daily SMA20 | 0.6215 |
| 1 | Daily SMA50 | 0.6165 |
| 2 | Daily SMA100 | 0.6193 |
| 3 | Daily SMA200 | 0.6228 |
The previous day high was 0.6133 while the previous day low was 0.607. The daily 38.2% Fib levels comes at 0.6109, expected to provide resistance. Similarly, the daily 61.8% fib level is at 0.6094, expected to provide support.
Note the levels of interest below:
- Pivot support is noted at 0.6058, 0.6033, 0.5995
- Pivot resistance is noted at 0.6122, 0.6159, 0.6185
| Levels | Levels.1 |
|---|---|
| Previous Daily High | 0.6133 |
| Previous Daily Low | 0.6070 |
| Previous Weekly High | 0.6226 |
| Previous Weekly Low | 0.6060 |
| Previous Monthly High | 0.6413 |
| Previous Monthly Low | 0.6120 |
| Daily Fibonacci 38.2% | 0.6109 |
| Daily Fibonacci 61.8% | 0.6094 |
| Daily Pivot Point S1 | 0.6058 |
| Daily Pivot Point S2 | 0.6033 |
| Daily Pivot Point S3 | 0.5995 |
| Daily Pivot Point R1 | 0.6122 |
| Daily Pivot Point R2 | 0.6159 |
| Daily Pivot Point R3 | 0.6185 |
[/s2If]
Download Nehcap EAWe have two EAs that are operational on our LIVE accounts.
- EA-FIX: Check out the details here. Download EA-FIX . EA-FIX is a non-grid HFT scalper.
- EA-GROWTH: High quality low dd EA using trend grids. Download EA_GROWTHJoin Our Telegram Group


