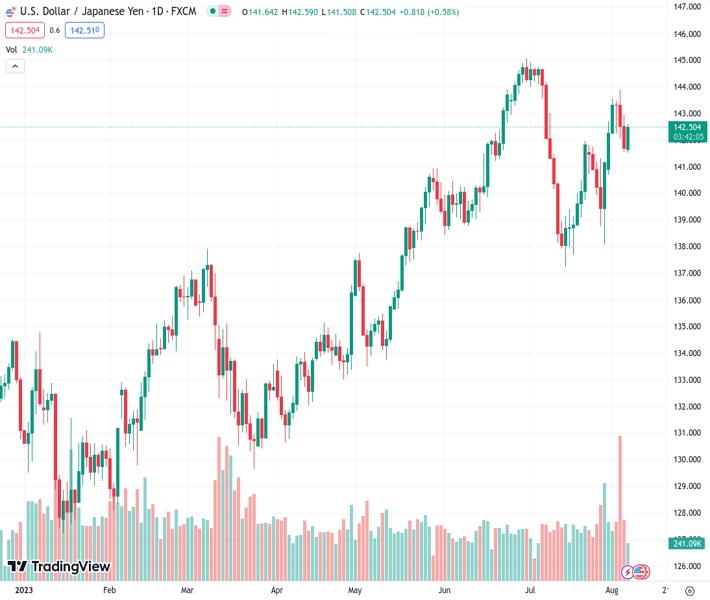
The US dollar to Japanese yen exchange rate is currently at 142.533. The job market in the US is starting to slow down, but there is a risk of increased inflation due to higher average hourly earnings.
…
This is a premium post.
[s2If !current_user_can(access_s2member_level4)]Please register for FREE REGISTER to read full post below containing analysis. In case of any error or you think you are not able to read the full post below, please email us at support#nehcap.com [lwa][/s2If] [s2If current_user_can(access_s2member_level1)]
- The US jobs market begins to cool down, but Average Hourly Earnings flash inflation risks tilted upside.
The pair currently trades last at 142.533.
The previous day high was 142.93 while the previous day low was 141.55. The daily 38.2% Fib levels comes at 142.08, expected to provide support. Similarly, the daily 61.8% fib level is at 142.4, expected to provide support.
USD/JPY advanced sharply during Monday’s North American session as the greenback strengthened amid a risk-on impulse following last week’s mixed US jobs data. Hawkish comments over the weekend by a Fed official sponsored the greenback advance. The USD/JPY is trading at 142.47, above its opening price by 0.55%.
Wall Street is trading with solid gains, portraying an upbeat mood, while US Treasury bond yields advance. Market participants’ reaction to last Friday’s US Nonfarm Payrolls reports missing estimates of 200K, coming at 187K, triggered a sell-off of the greenback, which has trimmed some of its losses, registering modest gains of 0.13%, as shown by the US Dollar Index (DXY).
Although the US jobs market showed signs of easing, inflationary pressures are still present, with Average Hourly Earnings remaining at 4.4% YoY, exceeding the consensus of 4.2%. That could spark another rise in inflation in the United States (US), which is expected to deliver its July report on August 10.
Estimates for the Consumer Price Index (CPI) in the United States (US) depict inflation falling to 3% from 3.3% in June, while Core CPI, which strips out volatile items, is estimated to decelerate to 4.7% YoY, from 4.8% in June.
The USD/JPY advancement was sponsored by hawkish comments by Michelle Bowman, who said the Fed would likely need to lift rates further to bring down inflation. On the dovish side of the spectrum, the New York Fed President John Williams noted that rate cuts could begin in early 2024, depending on economic data and if the inflation trend continued to edge lower.
Also, US Treasury bond yields, particularly the 10-year benchmark note, rise five basis points (bps) to 4.090%, a tailwind for the USD/JPY. Meanwhile, the DXY, a measure of the US Dollar’s value against six currencies, gains 0.12% and exchanges hands at 102.130.
The Bank of Japan (BoJ) Summary of Opinions confirms a dovish yield curve tweak, suggesting that further Japanese Yen (JPY) is expected in the near term. Most officials stressed the need to maintain the current monetary policy in place. At the same time, one member suggested that inflation would remain at 2% “in a sustainable and stable manner seems to have clearly come in sight.”
Technical Levels: Supports and Resistances
USDJPY currently trading at 142.52 at the time of writing. Pair opened at 141.76 and is trading with a change of 0.54 % .
| Overview | Overview.1 | |
|---|---|---|
| 0 | Today last price | 142.52 |
| 1 | Today Daily Change | 0.76 |
| 2 | Today Daily Change % | 0.54 |
| 3 | Today daily open | 141.76 |
The pair remains strongly bullish on the daily timeframe. It trades above its 20 SMA @ 140.63, 50 SMA 141.28, 100 SMA @ 137.88 and 200 SMA @ 136.58.
| Trends | Trends.1 | |
|---|---|---|
| 0 | Daily SMA20 | 140.63 |
| 1 | Daily SMA50 | 141.28 |
| 2 | Daily SMA100 | 137.88 |
| 3 | Daily SMA200 | 136.58 |
The previous day high was 142.93 while the previous day low was 141.55. The daily 38.2% Fib levels comes at 142.08, expected to provide support. Similarly, the daily 61.8% fib level is at 142.4, expected to provide support.
Note the levels of interest below:
- Pivot support is noted at 141.23, 140.7, 139.86
- Pivot resistance is noted at 142.6, 143.45, 143.98
| Levels | Levels.1 |
|---|---|
| Previous Daily High | 142.93 |
| Previous Daily Low | 141.55 |
| Previous Weekly High | 143.89 |
| Previous Weekly Low | 140.69 |
| Previous Monthly High | 144.91 |
| Previous Monthly Low | 137.24 |
| Daily Fibonacci 38.2% | 142.08 |
| Daily Fibonacci 61.8% | 142.40 |
| Daily Pivot Point S1 | 141.23 |
| Daily Pivot Point S2 | 140.70 |
| Daily Pivot Point S3 | 139.86 |
| Daily Pivot Point R1 | 142.60 |
| Daily Pivot Point R2 | 143.45 |
| Daily Pivot Point R3 | 143.98 |
[/s2If]
Download Nehcap EAWe have two EAs that are operational on our LIVE accounts.
- EA-FIX: Check out the details here. Download EA-FIX . EA-FIX is a non-grid HFT scalper.
- EA-GROWTH: High quality low dd EA using trend grids. Download EA_GROWTHJoin Our Telegram Group


