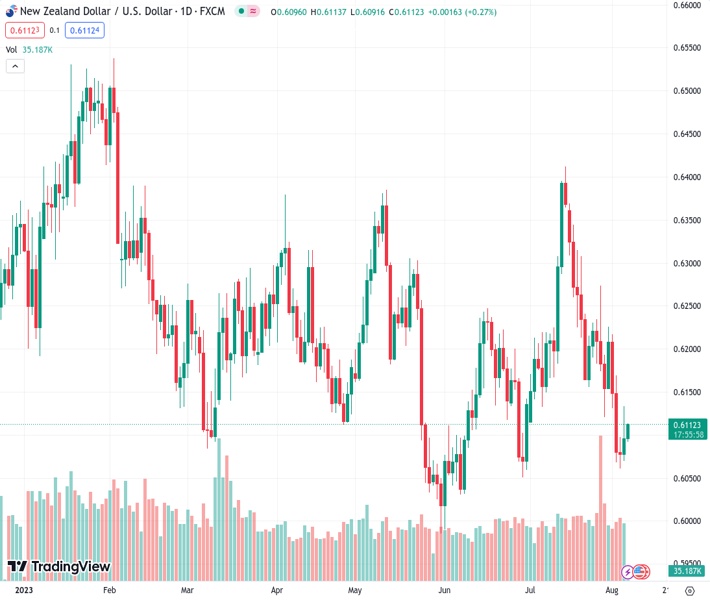
The NZDUSD currency pair, currently trading at 0.61124, has successfully defended its previous recovery from the significant Fibonacci retracement level. It is currently holding onto slight gains it has made recently. The viewpoint of @nehcap is that there is only expected to be a limited recovery in the near future.
…
This is a premium post.
[s2If !current_user_can(access_s2member_level4)]Please register for FREE REGISTER to read full post below containing analysis. In case of any error or you think you are not able to read the full post below, please email us at support#nehcap.com [lwa][/s2If] [s2If current_user_can(access_s2member_level1)]
- NZD/USD defends previous recovery from the key Fibonacci retracement level, clings to mild gains of late.
The pair currently trades last at 0.61124.
The previous day high was 0.6133 while the previous day low was 0.607. The daily 38.2% Fib levels comes at 0.6109, expected to provide support. Similarly, the daily 61.8% fib level is at 0.6094, expected to provide support.
NZD/USD renews its intraday high near 0.6115 as it extends the previous run-up during the mid-Asian session on Monday. In doing so, the Kiwi pair justifies the US Dollar’s struggle ahead of this week’s US Consumer Price Index (CPI) data while also cheering the optimism ahead of the Reserve Bank of New Zealand’s Inflation Expectations for the third quarter (Q3) of 2023.
That said, the bullish MACD signals and upbeat RSI (14) line, not overbought, favor the quote’s recovery moves from the 78.6% Fibonacci retracement of the May-July upside.
With this, the NZD/USD bulls appear well-set to challenge the previous support line stretched from May 31, close to 0.6140 by the press time.
Following that, the 61.8% Fibonacci retracement and a downward-sloping resistance line from July 14, respectively ear 0.6145 and 0.6150, will challenge the Kiwi buyers before giving them control.
Even so, the 200-SMA around 0.6195 and the 0.6200 round figure will act as the final defense of the NZD/USD bears.
On the flip side, the aforementioned 78.6% Fibonacci retracement puts a floor under the NZD/USD prices near 0.6070.
In a case where the Kiwi pair breaks the 0.6070 support, a horizontal region comprising multiple levels marked since late May, around 0.6030, could test the NZD/USD bears before directing them to the 0.6000 psychological magnet and the yearly low marked in May around 0.5985.
Trend: Limited recovery expected
Technical Levels: Supports and Resistances
NZDUSD currently trading at 0.611 at the time of writing. Pair opened at 0.6084 and is trading with a change of 0.43% % .
| Overview | Overview.1 | |
|---|---|---|
| 0 | Today last price | 0.611 |
| 1 | Today Daily Change | 0.0026 |
| 2 | Today Daily Change % | 0.43% |
| 3 | Today daily open | 0.6084 |
The pair remains strongly bearish on the daily time frame. It trades below the 20 SMA @ 0.6215, 50 SMA 0.6165, 100 SMA @ 0.6193 and 200 SMA @ 0.6228.
| Trends | Trends.1 | |
|---|---|---|
| 0 | Daily SMA20 | 0.6215 |
| 1 | Daily SMA50 | 0.6165 |
| 2 | Daily SMA100 | 0.6193 |
| 3 | Daily SMA200 | 0.6228 |
The previous day high was 0.6133 while the previous day low was 0.607. The daily 38.2% Fib levels comes at 0.6109, expected to provide support. Similarly, the daily 61.8% fib level is at 0.6094, expected to provide support.
Note the levels of interest below:
- Pivot support is noted at 0.6058, 0.6033, 0.5995
- Pivot resistance is noted at 0.6122, 0.6159, 0.6185
| Levels | Levels.1 |
|---|---|
| Previous Daily High | 0.6133 |
| Previous Daily Low | 0.6070 |
| Previous Weekly High | 0.6226 |
| Previous Weekly Low | 0.6060 |
| Previous Monthly High | 0.6413 |
| Previous Monthly Low | 0.6120 |
| Daily Fibonacci 38.2% | 0.6109 |
| Daily Fibonacci 61.8% | 0.6094 |
| Daily Pivot Point S1 | 0.6058 |
| Daily Pivot Point S2 | 0.6033 |
| Daily Pivot Point S3 | 0.5995 |
| Daily Pivot Point R1 | 0.6122 |
| Daily Pivot Point R2 | 0.6159 |
| Daily Pivot Point R3 | 0.6185 |
[/s2If]
Download Nehcap EAWe have two EAs that are operational on our LIVE accounts.
- EA-FIX: Check out the details here. Download EA-FIX . EA-FIX is a non-grid HFT scalper.
- EA-GROWTH: High quality low dd EA using trend grids. Download EA_GROWTHJoin Our Telegram Group


