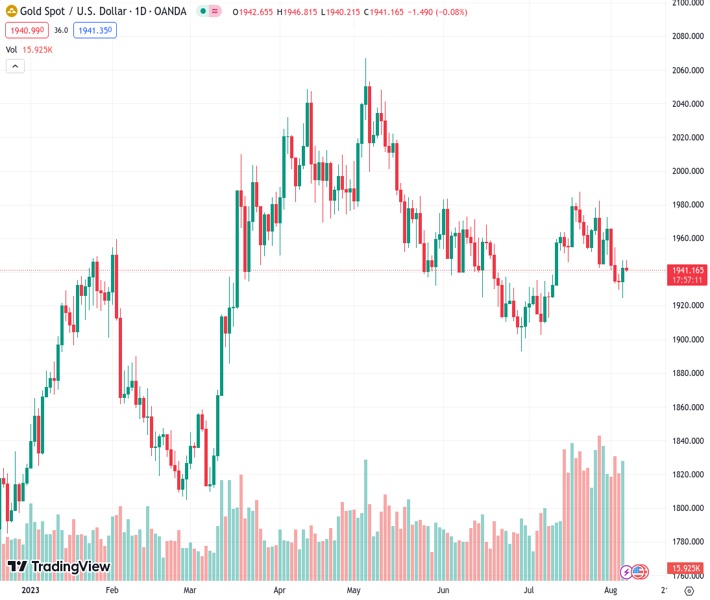
The price of gold, represented by #XAUUSD at 1,940.91, slightly declines on Monday due to increased buying of the US Dollar, which puts pressure on gold.
…
This is a premium post.
[s2If !current_user_can(access_s2member_level4)]Please register for FREE REGISTER to read full post below containing analysis. In case of any error or you think you are not able to read the full post below, please email us at support#nehcap.com [lwa][/s2If] [s2If current_user_can(access_s2member_level1)]
- Gold price edges lower on Monday and is pressured by the emergence of some US Dollar buying.
The pair currently trades last at 1940.91.
The previous day high was 1946.9 while the previous day low was 1925.72. The daily 38.2% Fib levels comes at 1938.81, expected to provide support. Similarly, the daily 61.8% fib level is at 1933.81, expected to provide support.
Gold price attracts some selling following an early uptick to the $1,946 area during the Asian session on Monday and drops to a fresh daily low in the last hour. The XAU/USD currently trades around the $1,940 region and for now, seems to have stalled its modest recovery move from the lowest level since July 11 touched on Friday.
The closely-watched monthly jobs data from the United States (US) showed that the economy maintained a moderate pace of job growth in July. Furthermore, the readings for May and June were revised down, suggesting that demand for workers was slowing. This halted the recent surge in Treasury yields and weighed heavily on the US Dollar (USD) on Friday, which was seen as a key factor that prompted some short-covering around the Gold price.
That said, solid wage gains and an unexpected downtick in the unemployment rate pointed to continued tightness in the labour market. This, in turn, reaffirms market expectations that the Federal Reserve (Fed) will keep interest rates higher for longer and assists the USD to attract some dip-buying on the first day of a new week. A stronger buck tends to act as a headwind for the US Dollar-denominated Gold price and is seen exerting some downward pressure.
Apart from this, the underlying bullish sentiment around the global equity markets, bolstered by continued support from the Chinese government, contributes to the mildly offered tone surrounding the safe-haven precious metal. The USD bulls, however, seem reluctant to place aggressive bets ahead of the crucial US consumer inflation data, due for release on Thursday. This, in turn, could lend some support to the Gold price and help limit the downside.
Moving ahead, there isn’t any relevant market-moving economic data due for release from the US on Monday. Hence, traders will take cues from speeches by influential Fed officials, which might drive the US bond yields and the USD demand. Apart from this, the broader risk sentiment could provide some impetus to the Gold price. The fundamental backdrop, meanwhile, seems tilted in favour of bears and supports prospects for an extension of over a two-week-old downtrend.
Technical Levels: Supports and Resistances
XAUUSD currently trading at 1940.36 at the time of writing. Pair opened at 1942.88 and is trading with a change of -0.13 % .
| Overview | Overview.1 | |
|---|---|---|
| 0 | Today last price | 1940.36 |
| 1 | Today Daily Change | -2.52 |
| 2 | Today Daily Change % | -0.13 |
| 3 | Today daily open | 1942.88 |
The pair is trading below its 20 Daily moving average @ 1954.54, below its 50 Daily moving average @ 1945.17 , below its 100 Daily moving average @ 1969.09 and above its 200 Daily moving average @ 1894.9
| Trends | Trends.1 | |
|---|---|---|
| 0 | Daily SMA20 | 1954.54 |
| 1 | Daily SMA50 | 1945.17 |
| 2 | Daily SMA100 | 1969.09 |
| 3 | Daily SMA200 | 1894.90 |
The previous day high was 1946.9 while the previous day low was 1925.72. The daily 38.2% Fib levels comes at 1938.81, expected to provide support. Similarly, the daily 61.8% fib level is at 1933.81, expected to provide support.
Note the levels of interest below:
- Pivot support is noted at 1930.1, 1917.32, 1908.92
- Pivot resistance is noted at 1951.28, 1959.68, 1972.46
| Levels | Levels.1 |
|---|---|
| Previous Daily High | 1946.90 |
| Previous Daily Low | 1925.72 |
| Previous Weekly High | 1972.45 |
| Previous Weekly Low | 1925.72 |
| Previous Monthly High | 1987.54 |
| Previous Monthly Low | 1902.77 |
| Daily Fibonacci 38.2% | 1938.81 |
| Daily Fibonacci 61.8% | 1933.81 |
| Daily Pivot Point S1 | 1930.10 |
| Daily Pivot Point S2 | 1917.32 |
| Daily Pivot Point S3 | 1908.92 |
| Daily Pivot Point R1 | 1951.28 |
| Daily Pivot Point R2 | 1959.68 |
| Daily Pivot Point R3 | 1972.46 |
[/s2If]
Download Nehcap EAWe have two EAs that are operational on our LIVE accounts.
- EA-FIX: Check out the details here. Download EA-FIX . EA-FIX is a non-grid HFT scalper.
- EA-GROWTH: High quality low dd EA using trend grids. Download EA_GROWTHJoin Our Telegram Group


