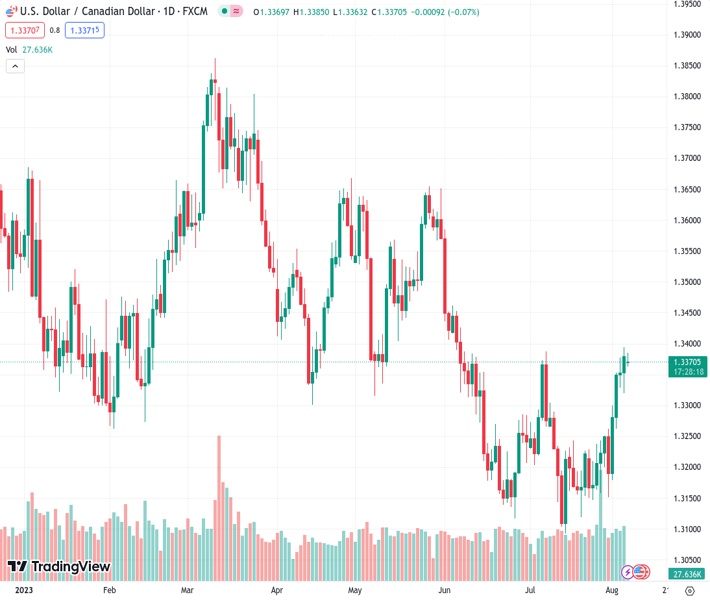
The USDCAD currency pair, trading at a rate of 1.33704, remains stable within a specific range near the 50% Fibonacci level during the Asian session on Monday.
…
This is a premium post.
[s2If !current_user_can(access_s2member_level4)]Please register for FREE REGISTER to read full post below containing analysis. In case of any error or you think you are not able to read the full post below, please email us at support#nehcap.com [lwa][/s2If] [s2If current_user_can(access_s2member_level1)]
- USD/CAD consolidates in a range around the 50% Fibo. through the Asian session on Monday.
The pair currently trades last at 1.33704.
The previous day high was 1.3394 while the previous day low was 1.332. The daily 38.2% Fib levels comes at 1.3366, expected to provide support. Similarly, the daily 61.8% fib level is at 1.3348, expected to provide support.
The USD/CAD pair kicks off the new week on a subdued note and oscillates in a narrow band around the 1.3370 area through the Asian session. Spot prices remain below a two-month peak touched on Friday and currently trade around the 50% Fibonacci retracement level of the May-July downfall.
Despite signs that demand for workers in the US was slowing, solid wage growth and a downtick in the unemployment rate pointed to continued tightness in the labour market. This should allow the Federal Reserve (Fed) will keep rates higher for longer and assists the USD to attract some dip-buying on Monday. The Canadian Dollar (CAD), on the other hand, is weighed down by the disappointing release of the domestic jobs report. Furthermore, Crude Oil prices ease from a fresh multi-month top and undermine the commodity-linked Loonie, which, in turn, acts as a tailwind for the USD/CAD pair.
The fundamental backdrop suggests that the path of least resistance for spot prices is to the upside, though bulls might still wait for sustained strength and acceptance beyond the 1.3400 mark, or the 100-day Simple Moving Average (SMA) before placing fresh bets. The USD/CAD pair might then climb to the 1.3445-1.3450 confluence hurdle, comprising the very important 200-day SMA and the 61.8% Fibo. level. The latter should act as a pivotal point, which if cleared will mark a fresh breakout and set the stage for an extension of the recent recovery from sub-1.3100 levels, or the YTD low touched in July.
On the flip side, the 1.3350 area now seems to protect the immediate downside ahead of the 38.2% Fibo. level, around the 1.3300 mark. The subsequent downfall is more likely to attract fresh buying near the 1.3250 horizontal support and remain limited near the 1.3225 region, or the 23.6% Fibo. level. That said, some follow-through selling will negate any near-term positive outlook and make the USD/CAD pair vulnerable to weakening below the 1.3200 mark. Spot prices might then accelerate the fall to the 1.3160-1.3150 intermediate support before eventually dropping to challenge the 1.3100 mark.
Technical Levels: Supports and Resistances
USDCAD currently trading at 1.3372 at the time of writing. Pair opened at 1.3378 and is trading with a change of -0.04 % .
| Overview | Overview.1 | |
|---|---|---|
| 0 | Today last price | 1.3372 |
| 1 | Today Daily Change | -0.0006 |
| 2 | Today Daily Change % | -0.0400 |
| 3 | Today daily open | 1.3378 |
The pair is trading above its 20 Daily moving average @ 1.3227, above its 50 Daily moving average @ 1.3279 , below its 100 Daily moving average @ 1.3402 and below its 200 Daily moving average @ 1.3456
| Trends | Trends.1 | |
|---|---|---|
| 0 | Daily SMA20 | 1.3227 |
| 1 | Daily SMA50 | 1.3279 |
| 2 | Daily SMA100 | 1.3402 |
| 3 | Daily SMA200 | 1.3456 |
The previous day high was 1.3394 while the previous day low was 1.332. The daily 38.2% Fib levels comes at 1.3366, expected to provide support. Similarly, the daily 61.8% fib level is at 1.3348, expected to provide support.
Note the levels of interest below:
- Pivot support is noted at 1.3334, 1.3289, 1.3259
- Pivot resistance is noted at 1.3408, 1.3439, 1.3483
| Levels | Levels.1 |
|---|---|
| Previous Daily High | 1.3394 |
| Previous Daily Low | 1.3320 |
| Previous Weekly High | 1.3394 |
| Previous Weekly Low | 1.3151 |
| Previous Monthly High | 1.3387 |
| Previous Monthly Low | 1.3093 |
| Daily Fibonacci 38.2% | 1.3366 |
| Daily Fibonacci 61.8% | 1.3348 |
| Daily Pivot Point S1 | 1.3334 |
| Daily Pivot Point S2 | 1.3289 |
| Daily Pivot Point S3 | 1.3259 |
| Daily Pivot Point R1 | 1.3408 |
| Daily Pivot Point R2 | 1.3439 |
| Daily Pivot Point R3 | 1.3483 |
[/s2If]
Download Nehcap EAWe have two EAs that are operational on our LIVE accounts.
- EA-FIX: Check out the details here. Download EA-FIX . EA-FIX is a non-grid HFT scalper.
- EA-GROWTH: High quality low dd EA using trend grids. Download EA_GROWTHJoin Our Telegram Group


