This research note forms part of an eight-phase technical analysis framework for investors. It is designed to strengthen market interpretation, process discipline, and risk awareness before indicators are used as confirmation tools.
Executive Context
Volatility defines the size of normal movement. A strategy that ignores volatility may place stops too close in active markets or targets too far away in quiet markets. For investors, volatility is not just a chart feature; it is a risk-management input.
Participation measures, including volume where available, help evaluate whether a move is supported by broader activity or occurring in thin conditions. In spot FX, volume data can vary by source, so it should be interpreted carefully.
Professional Uses
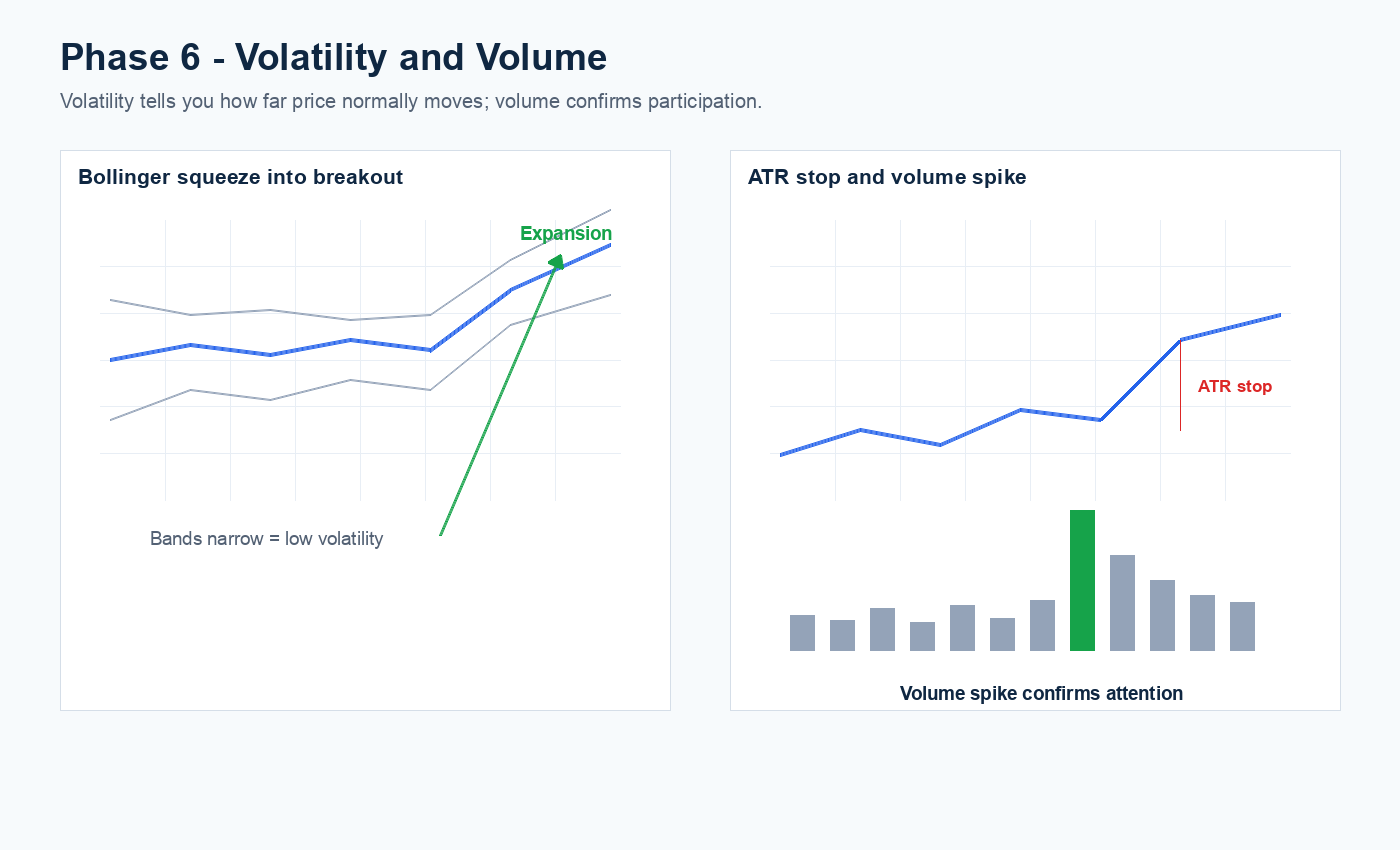
- ATR: estimates typical movement and helps set realistic stop and target distances.
- Bollinger Bands: show volatility compression and expansion around a moving average.
- Compression: narrow ranges may warn that a larger move is developing.
- Expansion: wider ranges may confirm that market activity is increasing.
Applied Market Scenario
If XAUUSD has an ATR of 25 dollars, a five-dollar stop may be unrealistic for a swing idea because normal movement can easily exceed it. A professional risk process adjusts stop distance and position size to current volatility rather than applying the same parameters in every market condition.
Client Takeaway
Volatility is where analysis meets risk. A technically attractive setup can still be poor if the stop, target, and position size do not respect current market movement.
This material is provided for education and market understanding only. It is not personal investment advice, a recommendation to trade, or a guarantee of future performance.
NEHCap System Highlight
HFT_FIX is our FIX-engine high-frequency FX model; NEDEX is an arbitrage framework for short-lived pricing inefficiencies; and CREST is a fast support/resistance trend system built for rapid structural shifts.
NEDEX and CREST can run across MT4, MT5, and FIX API environments, depending on broker infrastructure and deployment requirements.
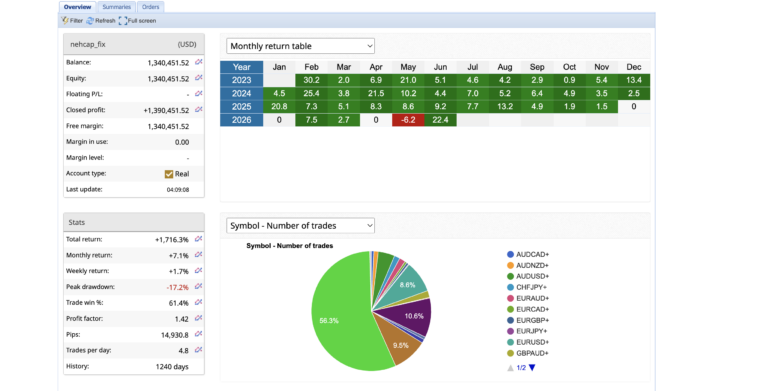
Live HFT_FIX tracking: View FXBlue account
System details: HFT_FIX | NEDEX | CREST
Contact: NEHCap contact | @mqlnehcap | t.me/nehcapmeta
Past performance is not a guarantee of future results. Trading involves risk.


