This research note forms part of an eight-phase technical analysis framework for investors. It is designed to strengthen market interpretation, process discipline, and risk awareness before indicators are used as confirmation tools.
Executive Context
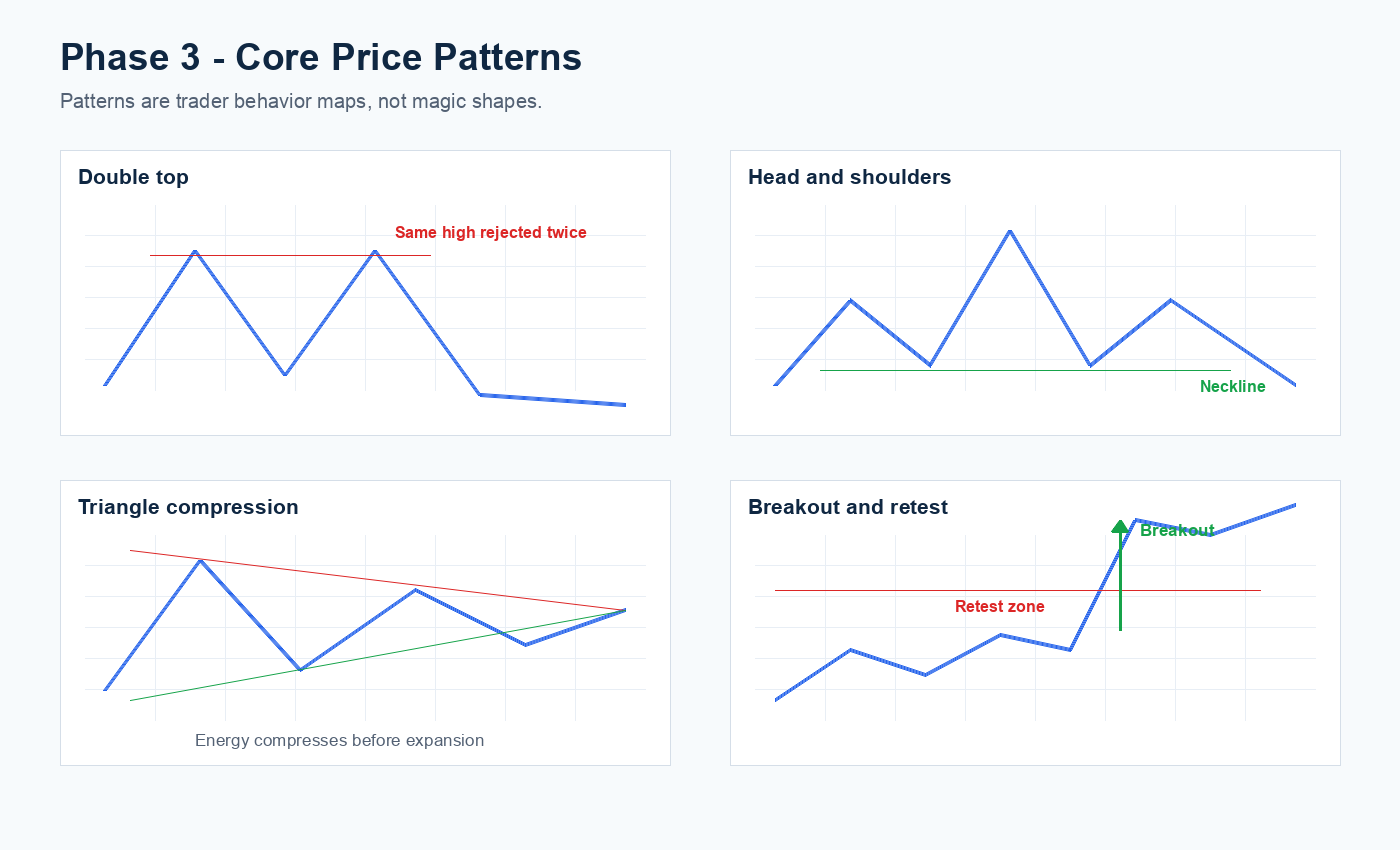
Price patterns matter because they capture repeated behavior. They are not valuable because of their names; they are valuable because they show how market participants respond around supply, demand, and uncertainty.
A professional investor does not trade a pattern simply because it appears on a chart. The pattern must sit inside a broader context, offer a clear invalidation level, and provide an acceptable risk-to-reward profile.
Patterns Worth Understanding
- Double top: buyers attempt to break a prior high twice and fail, suggesting supply may be increasing.
- Double bottom: sellers attempt to break a prior low twice and fail, suggesting demand may be absorbing pressure.
- Triangle: volatility compresses as buyers and sellers converge toward a decision point.
- Flag: a controlled pause after a strong move, often watched as a continuation structure.
Applied Market Scenario
If GBPUSD rallies into resistance, pulls back, and then fails at the same resistance again, that may form a double top. The professional question is not simply whether the pattern is present, but where the trade idea is invalidated. If price closes above the second high, the bearish thesis is weakened and risk should be reassessed.
Client Takeaway
Patterns should convert market behavior into a decision framework: entry zone, invalidation point, target area, and position size. Without those components, a pattern is only a drawing.
This material is provided for education and market understanding only. It is not personal investment advice, a recommendation to trade, or a guarantee of future performance.
NEHCap System Highlight
HFT_FIX is our FIX-engine high-frequency FX model; NEDEX is an arbitrage framework for short-lived pricing inefficiencies; and CREST is a fast support/resistance trend system built for rapid structural shifts.
NEDEX and CREST can run across MT4, MT5, and FIX API environments, depending on broker infrastructure and deployment requirements.
Live HFT_FIX tracking: View FXBlue account
System details: HFT_FIX | NEDEX | CREST
Contact: NEHCap contact | @mqlnehcap | t.me/nehcapmeta
Past performance is not a guarantee of future results. Trading involves risk.


