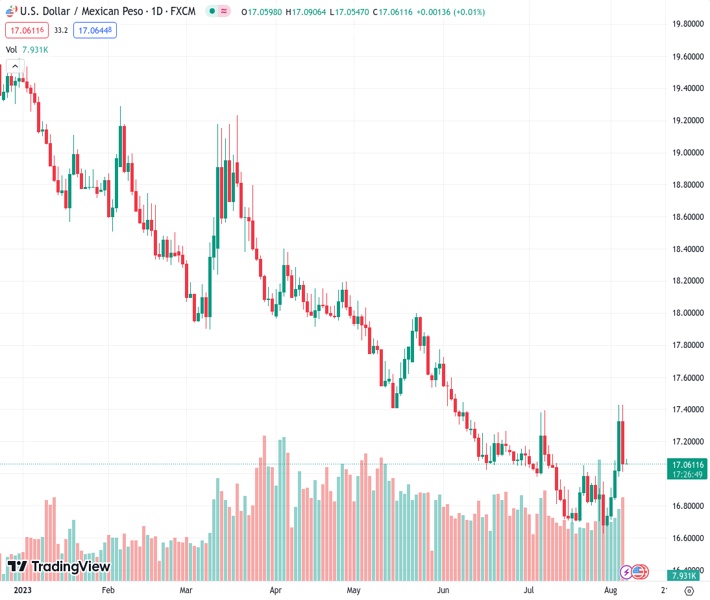
The US dollar to Mexican peso exchange rate at 17.0610 is staying at a lower level near the lowest point of the day. It is also protecting the previous day’s reversal from a support level that has now become a resistance level. According to @nehcap, there is an anticipation of additional decline in value.
…
This is a premium post.
[s2If !current_user_can(access_s2member_level4)]Please register for FREE REGISTER to read full post below containing analysis. In case of any error or you think you are not able to read the full post below, please email us at support#nehcap.com [lwa][/s2If] [s2If current_user_can(access_s2member_level1)]
- USD/MXN holds lower ground near intraday bottom, defends previous day’s U-turn from support-turned-resistance.
The pair currently trades last at 17.0610.
The previous day high was 17.4274 while the previous day low was 17.009. The daily 38.2% Fib levels comes at 17.1688, expected to provide resistance. Similarly, the daily 61.8% fib level is at 17.2675, expected to provide resistance.
USD/MXN bears keep the reins at the intraday low of around 17.04 during early Monday, keeping the previous day’s U-turn from the support-turned-resistance stretched from mid-May.
Adding strength to the downside bias about the Mexican Peso (MXN) pair is the quote’s clear downside break of the 50-DMA, as well as the cautious mood ahead of the inflation from Mexico and the US for July.
Even so, the bullish MACD signals and one-month-old horizontal support around the 17.00 round figure prods USD/MXN bears before giving them control.
In that case, 16.70 and the multi-month low marked in July around 16.60 will be in the spotlight.
Alternatively, the 50-DMA level of around 17.10 guards the immediate recovery of the USD/MXN pair ahead of the aforementioned support-turned-resistance, close to 17.38-40.
It should be noted that the Mexican Peso sellers remain off guard unless breaking the 100-DMA surrounding 17.55.
Above, the US and Mexican inflation data for July will be crucial to watch as the USD/MXN resumes the original downtrend. Should the scheduled data justify dovish concerns about the Fed and/or hopes of another rate hike from Banxico, the quote won’t hesitate to challenge the yearly low marked in July around 16.62.
Trend: Further weakness expected
Technical Levels: Supports and Resistances
USDMXN currently trading at 17.0575 at the time of writing. Pair opened at 17.09 and is trading with a change of -0.19% % .
| Overview | Overview.1 | |
|---|---|---|
| 0 | Today last price | 17.0575 |
| 1 | Today Daily Change | -0.0325 |
| 2 | Today Daily Change % | -0.19% |
| 3 | Today daily open | 17.09 |
The pair is trading above its 20 Daily moving average @ 16.8961, below its 50 Daily moving average @ 17.1098 , below its 100 Daily moving average @ 17.5603 and below its 200 Daily moving average @ 18.3153
| Trends | Trends.1 | |
|---|---|---|
| 0 | Daily SMA20 | 16.8961 |
| 1 | Daily SMA50 | 17.1098 |
| 2 | Daily SMA100 | 17.5603 |
| 3 | Daily SMA200 | 18.3153 |
The previous day high was 17.4274 while the previous day low was 17.009. The daily 38.2% Fib levels comes at 17.1688, expected to provide resistance. Similarly, the daily 61.8% fib level is at 17.2675, expected to provide resistance.
Note the levels of interest below:
- Pivot support is noted at 16.9235, 16.757, 16.5051
- Pivot resistance is noted at 17.3419, 17.5938, 17.7603
| Levels | Levels.1 |
|---|---|
| Previous Daily High | 17.4274 |
| Previous Daily Low | 17.0090 |
| Previous Weekly High | 17.4274 |
| Previous Weekly Low | 16.6694 |
| Previous Monthly High | 17.3957 |
| Previous Monthly Low | 16.6258 |
| Daily Fibonacci 38.2% | 17.1688 |
| Daily Fibonacci 61.8% | 17.2675 |
| Daily Pivot Point S1 | 16.9235 |
| Daily Pivot Point S2 | 16.7570 |
| Daily Pivot Point S3 | 16.5051 |
| Daily Pivot Point R1 | 17.3419 |
| Daily Pivot Point R2 | 17.5938 |
| Daily Pivot Point R3 | 17.7603 |
[/s2If]
Download Nehcap EAWe have two EAs that are operational on our LIVE accounts.
- EA-FIX: Check out the details here. Download EA-FIX . EA-FIX is a non-grid HFT scalper.
- EA-GROWTH: High quality low dd EA using trend grids. Download EA_GROWTHJoin Our Telegram Group


