Monday sees some sellers being attracted to the GBPUSD currency pair, which is being pushed down due to a slight increase in the strength of the USD.
…
This is a premium post.
[s2If !current_user_can(access_s2member_level4)]Please register for FREE REGISTER to read full post below containing analysis. In case of any error or you think you are not able to read the full post below, please email us at support#nehcap.com [lwa][/s2If] [s2If current_user_can(access_s2member_level1)]
- GBP/USD attracts some sellers on Monday and is pressured by modest USD strength.
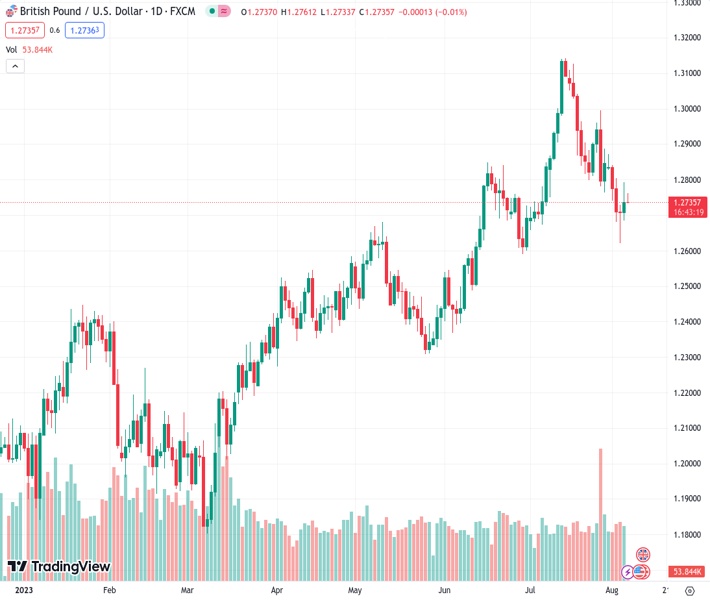
The pair currently trades last at 1.27364.
The previous day high was 1.2792 while the previous day low was 1.269. The daily 38.2% Fib levels comes at 1.2753, expected to provide resistance. Similarly, the daily 61.8% fib level is at 1.2729, expected to provide support.
The GBP/USD pair extends Friday’s late pullback from the 1.2800 neighbourhood and edges lower during the Asian session on Monday, though lacks follow-through selling. Spot prices currently trade around the 1.2735 region, representing the 50-day Simple Moving Average (SMA) and manage to hold comfortably above a five-week low touched last Thursday.
As investors look past Friday’s mixed US monthly employment details, the prospects for further policy tightening by the Federal Reserve (Fed) assist the US Dollar (USD) to attract some buying and act as a headwind for the GBP/USD pair. It is worth recalling that the headline US NFP missed consensus estimates and showed that the economy added 187K jobs in July. Adding to this, the readings for May and June were revised down, suggesting that demand for workers was slowing. That said, solid wage growth and a downtick in the unemployment rate pointed to continued tightness in the labour market. This keeps the door for one more 25 bps rate hike by the Federal Reserve (Fed) in September or November wide open and lends some support to the buck.
The British Pound (GBP), on the other hand, is undermined by the Bank of England’s (BoE) less hawkish forward guidance that rates were close to a peak. In fact, the UK central bank, after raising its key interest rate by 25 bps to a 15-year peak level of 5.25% last Thursday, stated that the current monetary policy stance is “restrictive”. This further contributes to a mildly offered tone surrounding the GBP/USD pair. The BoE, however, pushed back against market expectations for interest rate cuts in 2024 and warned that rates would stay higher for longer to bring inflation down to target. This, in turn, holds back traders from placing aggressive bearish bets around the major and warrants some caution before positioning for the resumption of a three-week-old downtrend.
Market participants might also prefer to move to the sidelines ahead of this week’s release of the latest US consumer inflation figures on Thursday and a slew of important UK macro data, including the monthly GDP print on Friday. In the meantime, speeches by influential FOMC members on Monday might influence the USD price dynamics and provide some impetus to the GBP/USD pair in the absence of any relevant market-moving economic releases. Nevertheless, the aforementioned mixed fundamental backdrop suggests that strong follow-through selling is needed to support prospects for a further intraday depreciating move.
Technical Levels: Supports and Resistances
GBPUSD currently trading at 1.2737 at the time of writing. Pair opened at 1.275 and is trading with a change of -0.1 % .
| Overview | Overview.1 | |
|---|---|---|
| 0 | Today last price | 1.2737 |
| 1 | Today Daily Change | -0.0013 |
| 2 | Today Daily Change % | -0.1000 |
| 3 | Today daily open | 1.2750 |
The pair is trading below its 20 Daily moving average @ 1.2894, above its 50 Daily moving average @ 1.2736 , above its 100 Daily moving average @ 1.2585 and above its 200 Daily moving average @ 1.2317
| Trends | Trends.1 | |
|---|---|---|
| 0 | Daily SMA20 | 1.2894 |
| 1 | Daily SMA50 | 1.2736 |
| 2 | Daily SMA100 | 1.2585 |
| 3 | Daily SMA200 | 1.2317 |
The previous day high was 1.2792 while the previous day low was 1.269. The daily 38.2% Fib levels comes at 1.2753, expected to provide resistance. Similarly, the daily 61.8% fib level is at 1.2729, expected to provide support.
Note the levels of interest below:
- Pivot support is noted at 1.2696, 1.2641, 1.2593
- Pivot resistance is noted at 1.2798, 1.2847, 1.2901
| Levels | Levels.1 |
|---|---|
| Previous Daily High | 1.2792 |
| Previous Daily Low | 1.2690 |
| Previous Weekly High | 1.2873 |
| Previous Weekly Low | 1.2621 |
| Previous Monthly High | 1.3142 |
| Previous Monthly Low | 1.2659 |
| Daily Fibonacci 38.2% | 1.2753 |
| Daily Fibonacci 61.8% | 1.2729 |
| Daily Pivot Point S1 | 1.2696 |
| Daily Pivot Point S2 | 1.2641 |
| Daily Pivot Point S3 | 1.2593 |
| Daily Pivot Point R1 | 1.2798 |
| Daily Pivot Point R2 | 1.2847 |
| Daily Pivot Point R3 | 1.2901 |
[/s2If]
Download Nehcap EAWe have two EAs that are operational on our LIVE accounts.
- EA-FIX: Check out the details here. Download EA-FIX . EA-FIX is a non-grid HFT scalper.
- EA-GROWTH: High quality low dd EA using trend grids. Download EA_GROWTHJoin Our Telegram Group


