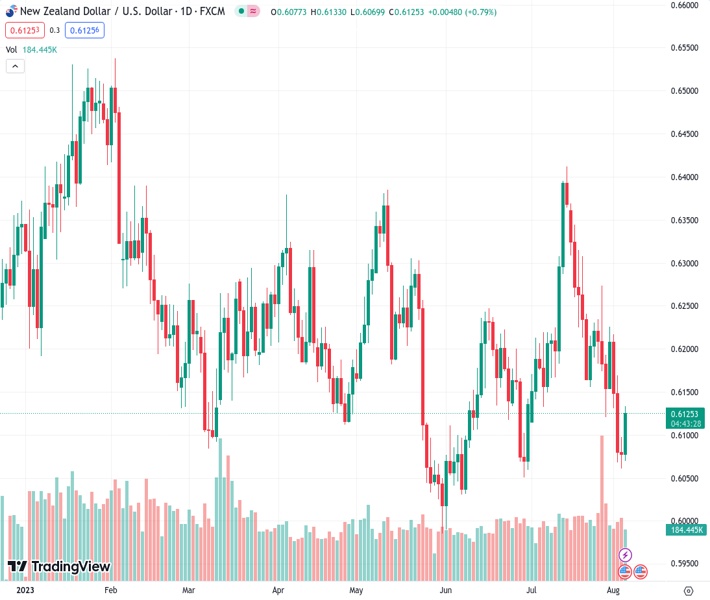
The New Zealand dollar against the US dollar, currently at a rate of 0.61256, has experienced an increase that has surpassed the 0.6100 level. However, it is expected to end the week with its third consecutive loss.
…
This is a premium post.
[s2If !current_user_can(access_s2member_level4)]Please register for FREE REGISTER to read full post below containing analysis. In case of any error or you think you are not able to read the full post below, please email us at support#nehcap.com [lwa][/s2If] [s2If current_user_can(access_s2member_level1)]
- NZD/USD jumped above the 0.6100 threshold but is poised to close a third consecutive weekly loss.
The pair currently trades last at 0.61256.
The previous day high was 0.6098 while the previous day low was 0.606. The daily 38.2% Fib levels comes at 0.6075, expected to provide support. Similarly, the daily 61.8% fib level is at 0.6083, expected to provide support.
At the end of the week, the NZD/USD rosed but will close a third consecutive weekly loss. Labour market data from the US came in mixed, and the USD DXY index weakened, falling below 102.00. That said, the sector continues to signal to remain unbalanced, which may limit the Greenback’s losses via steady hawkish bets on the Federal Reserve (Fed). On the other hand, New Zealand’s calendar won’t have anything relevant to offer.
Nonfarm Payrolls from the US showed mixed data. The headline showed 187,000 jobs created in July, lower than the 200,000 expected but above the revised figure of 185,000. In addition, Average Hourly Earning increased by 0.4% in the same month, above expectations, while the yearly figure rose to 4.4%. Furthermore, the Unemployment rate came in slightly lower than expected at 3.5% vs 3.6% expected.
According to the CME FedWatch tool, the odds of a 25 basis point (bps) hike in September remain unchanged, while the probabilities of an increase in November slightly rose near 30%. As the Federal Reserve (Fed) will remain data dependent, the next set of inflation data to be released next week will help investors model their expectations and affect the USD price dynamics.
The daily chart indicates a neutral to bullish technical outlook for NZD/USD in the short term. Although the Relative Strength Index (RSI) and the Moving Average Convergence Divergence (MACD) are still negative, they display encouraging signs of strength. Moreover,the pair is below the 20,100 and 200-day Simple Moving Averages (SMAs), indicating that the sellers dominate the broader perspective, and the buyers need to increase their efforts. In line with this, the bearish outlook on the weekly chart is more evident as the pair is set to close a third consecutive weekly loss, having declined nearly 4% since mid-July.
Support levels: 0.6100,0.6060, 0.6050.
Resistance levels:0.6130, 0.6150, 0.6200.
Technical Levels: Supports and Resistances
NZDUSD currently trading at 0.6126 at the time of writing. Pair opened at 0.6078 and is trading with a change of 0.79 % .
| Overview | Overview.1 | |
|---|---|---|
| 0 | Today last price | 0.6126 |
| 1 | Today Daily Change | 0.0048 |
| 2 | Today Daily Change % | 0.7900 |
| 3 | Today daily open | 0.6078 |
The pair remains strongly bearish on the daily time frame. It trades below the 20 SMA @ 0.6221, 50 SMA 0.6164, 100 SMA @ 0.6195 and 200 SMA @ 0.6226.
| Trends | Trends.1 | |
|---|---|---|
| 0 | Daily SMA20 | 0.6221 |
| 1 | Daily SMA50 | 0.6164 |
| 2 | Daily SMA100 | 0.6195 |
| 3 | Daily SMA200 | 0.6226 |
The previous day high was 0.6098 while the previous day low was 0.606. The daily 38.2% Fib levels comes at 0.6075, expected to provide support. Similarly, the daily 61.8% fib level is at 0.6083, expected to provide support.
Note the levels of interest below:
- Pivot support is noted at 0.6059, 0.6041, 0.6021
- Pivot resistance is noted at 0.6097, 0.6117, 0.6135
| Levels | Levels.1 |
|---|---|
| Previous Daily High | 0.6098 |
| Previous Daily Low | 0.6060 |
| Previous Weekly High | 0.6274 |
| Previous Weekly Low | 0.6120 |
| Previous Monthly High | 0.6413 |
| Previous Monthly Low | 0.6120 |
| Daily Fibonacci 38.2% | 0.6075 |
| Daily Fibonacci 61.8% | 0.6083 |
| Daily Pivot Point S1 | 0.6059 |
| Daily Pivot Point S2 | 0.6041 |
| Daily Pivot Point S3 | 0.6021 |
| Daily Pivot Point R1 | 0.6097 |
| Daily Pivot Point R2 | 0.6117 |
| Daily Pivot Point R3 | 0.6135 |
[/s2If]
Download Nehcap EAWe have two EAs that are operational on our LIVE accounts.
- EA-FIX: Check out the details here. Download EA-FIX . EA-FIX is a non-grid HFT scalper.
- EA-GROWTH: High quality low dd EA using trend grids. Download EA_GROWTHJoin Our Telegram Group


