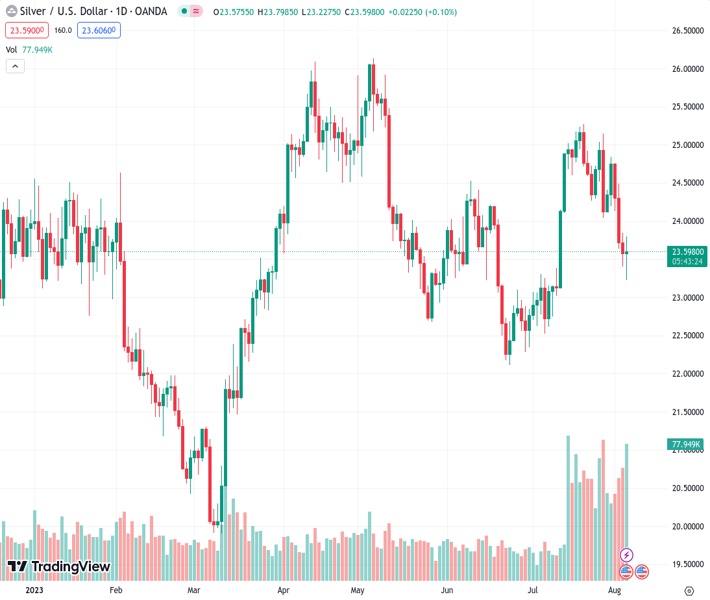
The XAGUSD pair, which represents the price of silver, experienced a slight rebound following the release of underwhelming US jobs data for July. It is now trading at $23.57, having bounced back from the 200-day exponential moving average (EMA) support level at $23.18.
…
This is a premium post.
[s2If !current_user_can(access_s2member_level4)]Please register for FREE REGISTER to read full post below containing analysis. In case of any error or you think you are not able to read the full post below, please email us at support#nehcap.com [lwa][/s2If] [s2If current_user_can(access_s2member_level1)]
- Silver (XAG/USD) stages a modest recovery after July’s US jobs data missed estimates, trading at $23.57, bouncing off the 200-day EMA at $23.18.
The pair currently trades last at 23.588.
The previous day high was 23.84 while the previous day low was 23.41. The daily 38.2% Fib levels comes at 23.57, expected to provide support. Similarly, the daily 61.8% fib level is at 23.68, expected to provide resistance.
Silver price is staging a slight recovery on Friday after US jobs data for July missed estimates, spurring XAG/USD’s bounce at around the 200-day Exponential Moving Average (EMA) at $23.18 a troy ounce as US Treasury bond yields tank. The XAG/USD is exchanging hands at $23.57 after hitting a daily low of $23.23.
From a technical perspective, XAG/USD bias shifted to neutral biased as long as buyers keep prices from diving below the 200-day EMA and above the July 6 low of $22.53. Even though XAG/USD is trimming some losses, It remains subject to further selling pressure, with the 100-day EMA at $23.67 capping any Silver’s rallies and the Relative Strength Index (RSI) indicating that sellers remain in charge.
If XAG/USD reclaims the 100-day EMA, that will put into play two more daily EMAs acting as resistance, the 50 and the 20-day EMAs, each at $23.90 and $24.07, respectively. Conversely, buyers’ failure at $23.67 could send the white metal slumping toward the 200-day EMA, ahead of challenging the $23.00 figure.
Technical Levels: Supports and Resistances
XAGUSD currently trading at 23.58 at the time of writing. Pair opened at 23.57 and is trading with a change of 0.04 % .
| Overview | Overview.1 | |
|---|---|---|
| 0 | Today last price | 23.58 |
| 1 | Today Daily Change | 0.01 |
| 2 | Today Daily Change % | 0.04 |
| 3 | Today daily open | 23.57 |
The pair is trading below its 20 Daily moving average @ 24.32, below its 50 Daily moving average @ 23.72 , below its 100 Daily moving average @ 24.03 and above its 200 Daily moving average @ 23.15
| Trends | Trends.1 | |
|---|---|---|
| 0 | Daily SMA20 | 24.32 |
| 1 | Daily SMA50 | 23.72 |
| 2 | Daily SMA100 | 24.03 |
| 3 | Daily SMA200 | 23.15 |
The previous day high was 23.84 while the previous day low was 23.41. The daily 38.2% Fib levels comes at 23.57, expected to provide support. Similarly, the daily 61.8% fib level is at 23.68, expected to provide resistance.
Note the levels of interest below:
- Pivot support is noted at 23.37, 23.17, 22.94
- Pivot resistance is noted at 23.81, 24.04, 24.24
| Levels | Levels.1 |
|---|---|
| Previous Daily High | 23.84 |
| Previous Daily Low | 23.41 |
| Previous Weekly High | 25.15 |
| Previous Weekly Low | 24.04 |
| Previous Monthly High | 25.27 |
| Previous Monthly Low | 22.52 |
| Daily Fibonacci 38.2% | 23.57 |
| Daily Fibonacci 61.8% | 23.68 |
| Daily Pivot Point S1 | 23.37 |
| Daily Pivot Point S2 | 23.17 |
| Daily Pivot Point S3 | 22.94 |
| Daily Pivot Point R1 | 23.81 |
| Daily Pivot Point R2 | 24.04 |
| Daily Pivot Point R3 | 24.24 |
[/s2If]
Download Nehcap EAWe have two EAs that are operational on our LIVE accounts.
- EA-FIX: Check out the details here. Download EA-FIX . EA-FIX is a non-grid HFT scalper.
- EA-GROWTH: High quality low dd EA using trend grids. Download EA_GROWTHJoin Our Telegram Group


