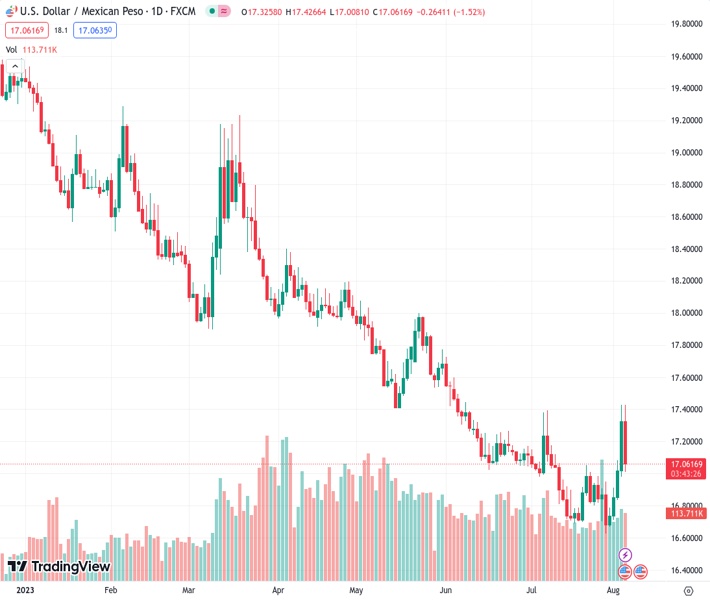
The US dollar to Mexican peso exchange rate falls by over 1.50%, but manages to hold onto the significant 17.0000 level.
…
This is a premium post.
[s2If !current_user_can(access_s2member_level4)]Please register for FREE REGISTER to read full post below containing analysis. In case of any error or you think you are not able to read the full post below, please email us at support#nehcap.com [lwa][/s2If] [s2If current_user_can(access_s2member_level1)]
- USD/MXN drops more than 1.50%, but clings to the 17.0000 psychological level.
The pair currently trades last at 17.0636.
The previous day high was 17.4273 while the previous day low was 16.9936. The daily 38.2% Fib levels comes at 17.2617, expected to provide resistance. Similarly, the daily 61.8% fib level is at 17.1593, expected to provide resistance.
USD/MXN erases some of its Thursday’s gains on Friday after a softer employment report in the United States (US) shruggs off presure on the Federal Reserve (Fed) to continue to tighten monetary conditions. Consequently, the US Dollar (USD) weakened, a tailwind for the Mexican Peso (MXN). The USD/MXN is trading at 17.0579, losses 1.55%, in the middle of the North American session.
The USD/MXN is clinging ot its downward biased, though a daily close above 17.0000 could pave the way for further upside. Improvement on risk appetite, bolstered the MXN, as shown by US equities trading with gains, while US bond yields dropped.
On the data front, the US Nonfarm Payrolls report for July missed estimates of 200K, dipping to 187K weighs on the greenback. Consequently, the Unemployment Rate rose by 3.6^%, above forecasts of 3.5%, while Average Hourly Earnings climbed by 4.4% YoY, more than estimated. That could refrain the Fed from standing put on interest rates, despite increasing borrowing costs by 525 basis points since March 2022.
Of note, USD/MXN traders must remember the Federal Reserve is on data-dependant mode, but one piece of good news, regarding employment, inflation or growth, would not shift its stance. Most Fed officials have expressed the need to see a clear trend of easing conditions, so they can modify its posture.
In the meantime, the US Dollar Index (DXY), a measure of the buck’s value against a basket of peers, dives 0.70%, trades at 101.766, undermined by falling US Treasury bond yields. The US 10-year Treasury note is plunging eleven basis points to 4.066%, reversing most of its Thursday’
Across the border, the Mexican economic docket revealed that Gross Fixed Investment rose 4.5% MoM, above May’s 0%.
Ahead into the next week, the US economic agenda will feature July’s inflation report, the Balance of Trade, and Fed speakers as the main highlight. On the Mexican front, Consumer Confidence and inflation rate, would update its status, vigilated closely by the Bank of Mexico (Banxico), which has kept rates unchanged during the last three monetary policy meetings.
After achieving its best week since March 2023, the USD/MXN downtrend remains in play until the pair achieves a daily close above May 17 daily low at 17.4039, which could pave the way for a shift on the USD/MXN bias, exposing key resistance levels. Firstly, the 100-day Exponential Moving Average (EMA) at 17.5182, followed by the May 31 swing high of 17.7724, followed by the 18.0000 mark. Conversely, if USD/MXN achieves a daily close below the 17.0000 figure, the pair could re-test the year-to-date (YTD) Lows of 16.6238.
Technical Levels: Supports and Resistances
USDMXN currently trading at 17.0464 at the time of writing. Pair opened at 17.3488 and is trading with a change of -1.74 % .
| Overview | Overview.1 | |
|---|---|---|
| 0 | Today last price | 17.0464 |
| 1 | Today Daily Change | -0.3024 |
| 2 | Today Daily Change % | -1.7400 |
| 3 | Today daily open | 17.3488 |
The pair is trading above its 20 Daily moving average @ 16.8986, below its 50 Daily moving average @ 17.1205 , below its 100 Daily moving average @ 17.5785 and below its 200 Daily moving average @ 18.3289
| Trends | Trends.1 | |
|---|---|---|
| 0 | Daily SMA20 | 16.8986 |
| 1 | Daily SMA50 | 17.1205 |
| 2 | Daily SMA100 | 17.5785 |
| 3 | Daily SMA200 | 18.3289 |
The previous day high was 17.4273 while the previous day low was 16.9936. The daily 38.2% Fib levels comes at 17.2617, expected to provide resistance. Similarly, the daily 61.8% fib level is at 17.1593, expected to provide resistance.
Note the levels of interest below:
- Pivot support is noted at 17.0859, 16.8229, 16.6522
- Pivot resistance is noted at 17.5195, 17.6902, 17.9532
| Levels | Levels.1 |
|---|---|
| Previous Daily High | 17.4273 |
| Previous Daily Low | 16.9936 |
| Previous Weekly High | 17.0097 |
| Previous Weekly Low | 16.6258 |
| Previous Monthly High | 17.3957 |
| Previous Monthly Low | 16.6258 |
| Daily Fibonacci 38.2% | 17.2617 |
| Daily Fibonacci 61.8% | 17.1593 |
| Daily Pivot Point S1 | 17.0859 |
| Daily Pivot Point S2 | 16.8229 |
| Daily Pivot Point S3 | 16.6522 |
| Daily Pivot Point R1 | 17.5195 |
| Daily Pivot Point R2 | 17.6902 |
| Daily Pivot Point R3 | 17.9532 |
[/s2If]
Download Nehcap EAWe have two EAs that are operational on our LIVE accounts.
- EA-FIX: Check out the details here. Download EA-FIX . EA-FIX is a non-grid HFT scalper.
- EA-GROWTH: High quality low dd EA using trend grids. Download EA_GROWTHJoin Our Telegram Group


