Weaker Dollar and lower Treasury yields boosts the yellow metal. (Pivot Orderbook analysis)
…
This is a premium post.
[s2If !current_user_can(access_s2member_level4)]Please register for PREMIUM VERSION HERE to read full post below containing analysis. In case of any error or you think you are not able to read the full post below, please email us at support#nehcap.com [lwa][/s2If] [s2If current_user_can(access_s2member_level4)]
- Weaker Dollar and lower Treasury yields boosts the yellow metal.
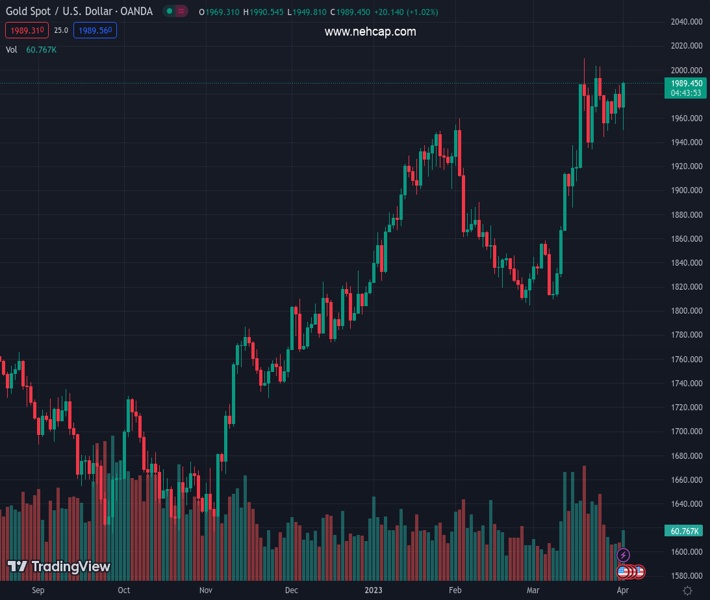
- XAU/USD up by $40 from Monday’s low, approaches $2,000.
The pair currently trades last at 1986.09.
The previous day high was 1987.7 while the previous day low was 1966.95. The daily 38.2% Fib levels comes at 1974.88, expected to provide support. Similarly, the daily 61.8% fib level is at 1979.77, expected to provide support.
Gold price is up by almost 1% on Monday, after rising more than $40 from the daily low. XAU/USD bottomed on Asian hours at $1,949 and then reversed it course. Recently reached at $1,990 the highest level in a week. It remains near the high, with a positive tone as the US Dollar tumbles.
After a negative weekly opening market by the shock from the OPEC+ unexpected production cut, gold stabilize and on European hours started to move higher. It accelerated after the beginning of the American session. It is hovering around $1,990 looking at the $2,000 area.
The yellow metal gained momentum amid a slide in US yields, a weaker US Dollar and risk appetite. The US 10-year yield fell to 3.40% after the release of the US ISM Manufacturing PMI. The US Dollar Index is down by 0.45%, hovering around 102.15, after reaching levels under 102.00. In Wall Street the Dow Jones is gaining by 0.68% and the S&P 500 is flat.
The positive tone in XAU/USD could trigger more gains and a test of the $2,000 area. A daily close above would point to further gains. Another failure at current levels could trigger a bearish correction. Large price swing could continue, taking into account what’s ahead in the economic calendar. After today’s softer ISM Manufacturing PMI, attention turns to Wednesday’s ADP Private Employment and ISM Service PMI; on Friday the official employment report is due.
Technical Levels: Supports and Resistances
XAUUSD currently trading at 1986.09 at the time of writing. Pair opened at 1969.0 and is trading with a change of 0.87 % .
| Overview | Overview.1 | |
|---|---|---|
| 0 | Today last price | 1986.09 |
| 1 | Today Daily Change | 17.09 |
| 2 | Today Daily Change % | 0.87 |
| 3 | Today daily open | 1969.00 |
The pair remains strongly bullish on the daily timeframe. It trades above its 20 SMA @ 1926.26, 50 SMA 1893.07, 100 SMA @ 1852.78 and 200 SMA @ 1783.91.
| Trends | Trends.1 | |
|---|---|---|
| 0 | Daily SMA20 | 1926.26 |
| 1 | Daily SMA50 | 1893.07 |
| 2 | Daily SMA100 | 1852.78 |
| 3 | Daily SMA200 | 1783.91 |
The previous day high was 1987.7 while the previous day low was 1966.95. The daily 38.2% Fib levels comes at 1974.88, expected to provide support. Similarly, the daily 61.8% fib level is at 1979.77, expected to provide support.
Note the levels of interest below:
- Pivot support is noted at 1961.4, 1953.8, 1940.65
- Pivot resistance is noted at 1982.15, 1995.3, 2002.9
| Levels | Levels.1 |
|---|---|
| Previous Daily High | 1987.70 |
| Previous Daily Low | 1966.95 |
| Previous Weekly High | 1987.70 |
| Previous Weekly Low | 1944.08 |
| Previous Monthly High | 2009.88 |
| Previous Monthly Low | 1809.46 |
| Daily Fibonacci 38.2% | 1974.88 |
| Daily Fibonacci 61.8% | 1979.77 |
| Daily Pivot Point S1 | 1961.40 |
| Daily Pivot Point S2 | 1953.80 |
| Daily Pivot Point S3 | 1940.65 |
| Daily Pivot Point R1 | 1982.15 |
| Daily Pivot Point R2 | 1995.30 |
| Daily Pivot Point R3 | 2002.90 |
[/s2If]
Join Our Telegram Group


