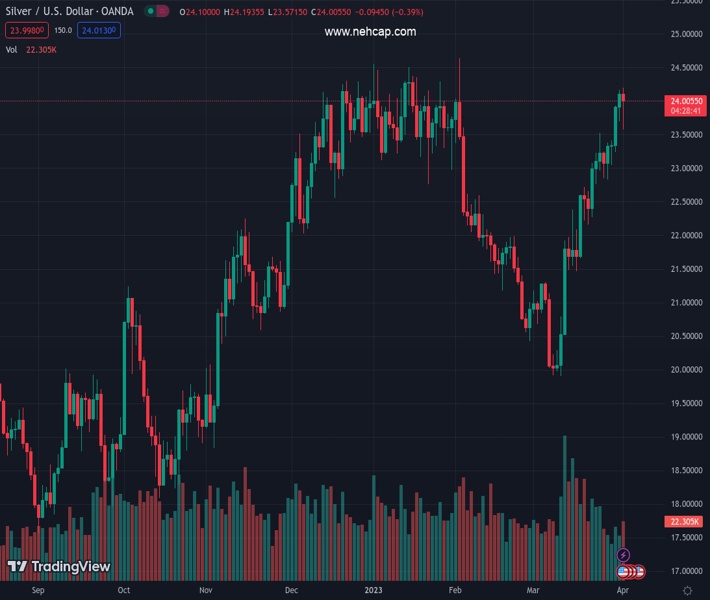
#XAGUSD @ 24.002 Silver price dips but staus nearby YTD highs as the US Dollar weakens. (Pivot Orderbook analysis)
…
This is a premium post.
[s2If !current_user_can(access_s2member_level4)]Please register for PREMIUM VERSION HERE to read full post below containing analysis. In case of any error or you think you are not able to read the full post below, please email us at support#nehcap.com [lwa][/s2If] [s2If current_user_can(access_s2member_level4)]
- Silver price dips but staus nearby YTD highs as the US Dollar weakens.
- XAG/USD is underpinned as US Treasury bond yields collapse with investors pricing a less aggressive Fed.
- St Louis Fed President Bullard forecasts rates above 5%, says OPEC’s oil production cut will make Fed’s work “difficult.”
The pair currently trades last at 24.002.
The previous day high was 24.16 while the previous day low was 23.7. The daily 38.2% Fib levels comes at 23.98, expected to provide support. Similarly, the daily 61.8% fib level is at 23.87, expected to provide support.
Silver price is trading below its opening price by around 0.37%, though it stays above the $24.00 threshold. Falling US Treasury bond yields and a soft US Dollar (USD) are two reasons for XAG/USD’s rise. At the time of writing, the XAG/USD exchanges hands at $24.01.
The sentiment is deteriorating. US equities fluctuated after the S&P and the ISM Manufacturing PMIs, showing that business activity in the US is contracting. Recessionary fears are rising, and tighter lending conditions are weighing on businesses.
Therefore, safe-haven flows towards the precious metal segment, maintaining Silver prices nearby yearly highs. US Treasury bond yields are collapsing as investors have begun to price in a less aggressive US Federal Reserve (Fed), even though an official estimates rates above 5%.
The St Louis Fed President James Bullard said that the Fed needs to raise rates above 5% and emphasized that his forecast is above the median. Bullard commented that OPEC’s cutting oil output would make the Fed’s work “difficult.”
The US Dollar Index, a measure of the buck’s performance vs. six peers, tumbles 0.41%, at 102.168.
Another reason that keeps the commodity prices higher is the Organization of Petroleum Exporting Countries and its allies’ (OPEC+) decision to reduce oil production by 1 million barrels, which led to a boost in oil prices.
Silver’s uptrend remains intact, though testing a four-month-old resistance trendline that passes around $24.20-30. Although it opened the door for a pullback, oscillators suggest the bias remains bullish. The Relative Strength Index (RSI) is exiting overbought conditions, giving buyers a respite. At the same time, the Rate of Change (RoC), portrays that buyers remain in control but take a pause.
IF the XAG/USD breaks $24.20, it will exacerbate a test of the YTD high at $24.63, followed by the $25.00 figure. On the other hand, a daily close below $24.00 could open the door for a pullback toward the March 24 high of $23.52.
Technical Levels: Supports and Resistances
XAGUSD currently trading at 24.0 at the time of writing. Pair opened at 24.08 and is trading with a change of -0.33 % .
| Overview | Overview.1 | |
|---|---|---|
| 0 | Today last price | 24.00 |
| 1 | Today Daily Change | -0.08 |
| 2 | Today Daily Change % | -0.33 |
| 3 | Today daily open | 24.08 |
The pair remains strongly bullish on the daily timeframe. It trades above its 20 SMA @ 22.17, 50 SMA 22.21, 100 SMA @ 22.59 and 200 SMA @ 21.03.
| Trends | Trends.1 | |
|---|---|---|
| 0 | Daily SMA20 | 22.17 |
| 1 | Daily SMA50 | 22.21 |
| 2 | Daily SMA100 | 22.59 |
| 3 | Daily SMA200 | 21.03 |
The previous day high was 24.16 while the previous day low was 23.7. The daily 38.2% Fib levels comes at 23.98, expected to provide support. Similarly, the daily 61.8% fib level is at 23.87, expected to provide support.
Note the levels of interest below:
- Pivot support is noted at 23.8, 23.51, 23.33
- Pivot resistance is noted at 24.27, 24.45, 24.73
| Levels | Levels.1 |
|---|---|
| Previous Daily High | 24.16 |
| Previous Daily Low | 23.70 |
| Previous Weekly High | 24.16 |
| Previous Weekly Low | 22.83 |
| Previous Monthly High | 24.16 |
| Previous Monthly Low | 19.90 |
| Daily Fibonacci 38.2% | 23.98 |
| Daily Fibonacci 61.8% | 23.87 |
| Daily Pivot Point S1 | 23.80 |
| Daily Pivot Point S2 | 23.51 |
| Daily Pivot Point S3 | 23.33 |
| Daily Pivot Point R1 | 24.27 |
| Daily Pivot Point R2 | 24.45 |
| Daily Pivot Point R3 | 24.73 |
[/s2If]
Join Our Telegram Group


