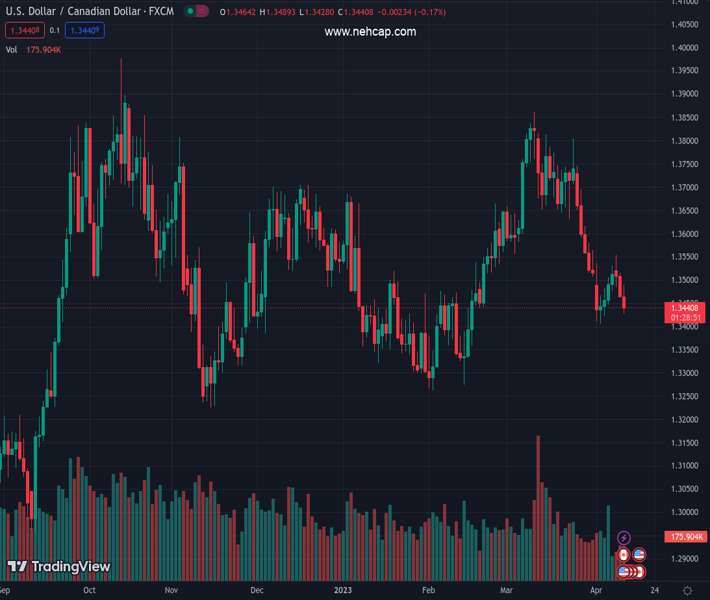
#USDCAD @ 1.34339 US factory activity shows signs of decline in March. (Pivot Orderbook analysis)
…
This is a premium post.
[s2If !current_user_can(access_s2member_level4)]Please register for PREMIUM VERSION HERE to read full post below containing analysis. In case of any error or you think you are not able to read the full post below, please email us at support#nehcap.com [lwa][/s2If] [s2If current_user_can(access_s2member_level4)]
- US factory activity shows signs of decline in March.
- The Canadian Dollar appreciated due to OPEC’s announcing a cut in oil production.
- USD/CAD Price Analysis: To stay downward biased below 1.3500; otherwise, expect a rally to 1.3600.
The pair currently trades last at 1.34339.
The previous day high was 1.3564 while the previous day low was 1.3508. The daily 38.2% Fib levels comes at 1.3529, expected to provide resistance. Similarly, the daily 61.8% fib level is at 1.3543, expected to provide resistance.
USD/CAD trades south of the 100-day Exponential Moving Average (EMA) as the Canadian Dollar (CAD) appreciated on oil supply shortages and a soft US Dollar (USD). The USD/CAD is exchanging hands at 1.3450 after hitting a daily high of 1.3536.
Wall Street portrays an upbeat sentiment. Two measures of factory activity in the United States (US), deteriorated, meaning a deeper economic slowdown is around the corner. The S&P Global Manufacturing PMI for March was 49.2, below 49.3 estimates. Later, the Institute for Supply Management (ISM) revealed its Manufacturing PMI, which plunged to 46.3, below the 47.5 foresaw and below February’s data.
Consequently, the greenback erased some of its earlier gains, bolstered by higher oil prices. The US Dollar Index (DXY), which tracks the buck’s value vs. a basket of six currencies, slides from 103.05 to 102.20, down 0.38%.
Hence, the USD/CAD dropped from around 1.3500 and registered a daily low of 1.3424 as traders began to price in a less aggressive US Federal Reserve (Fed).
The Organization of Petroleum Exporting Countries and its allies (OPEC+) announced over the weekend the cut of 1 million barrels of oil gave oil prices a leg up. WTI jumped over $6.00 from its Friday close at $75.68 to $81.00 a barrel.
The latest round of Fed speakers, led by the St. Louis Fed President James Bullard, said that OPEC’s decision would make the Fed’s job more difficult. Bullard reiterated that the Fed needs to raise rates above 5% and emphasized that his forecast is above the median.
On the Canadian front, the S&P Global Manufacturing PMI plummeted to 48.6 from the prior’s figure of 52.4, painting a gloomy economic outlook for Canada’s economy. Of late, the Bank of Canada’s (BoC) Business Outlook Survey (BOS) showed that around half of the firms surveyed expect the country to be in a mild recession. Additionally, 59% of businesses expect inflation above 2% until at least 2025.
The USD/CAD tumbled below 1.3519, the 100-day EMA, which exacerbated a break below 1.3500. Although the USD/CAD pair reached a weekly low of 1.3424, the pair has recovered some ground as sentiment continues to deteriorate amidst recessionary scenarios. The USD/CAD neutral to downwards trend will continue if the pair stays below the 100-day EMA. A breach of the 1.3400 figure will expose the 200-day EMA At 1.3371. On the flip side, buyers reclaiming 1.3500 would pave the way to recover the 100-day EMA and beyond.
Technical Levels: Supports and Resistances
USDCAD currently trading at 1.3461 at the time of writing. Pair opened at 1.3519 and is trading with a change of -0.43 % .
| Overview | Overview.1 | |
|---|---|---|
| 0 | Today last price | 1.3461 |
| 1 | Today Daily Change | -0.0058 |
| 2 | Today Daily Change % | -0.4300 |
| 3 | Today daily open | 1.3519 |
The pair is trading below its 20 Daily moving average @ 1.3695, below its 50 Daily moving average @ 1.3543 , below its 100 Daily moving average @ 1.3522 and above its 200 Daily moving average @ 1.3375
| Trends | Trends.1 | |
|---|---|---|
| 0 | Daily SMA20 | 1.3695 |
| 1 | Daily SMA50 | 1.3543 |
| 2 | Daily SMA100 | 1.3522 |
| 3 | Daily SMA200 | 1.3375 |
The previous day high was 1.3564 while the previous day low was 1.3508. The daily 38.2% Fib levels comes at 1.3529, expected to provide resistance. Similarly, the daily 61.8% fib level is at 1.3543, expected to provide resistance.
Note the levels of interest below:
- Pivot support is noted at 1.3496, 1.3474, 1.344
- Pivot resistance is noted at 1.3553, 1.3587, 1.361
| Levels | Levels.1 |
|---|---|
| Previous Daily High | 1.3564 |
| Previous Daily Low | 1.3508 |
| Previous Weekly High | 1.3745 |
| Previous Weekly Low | 1.3508 |
| Previous Monthly High | 1.3862 |
| Previous Monthly Low | 1.3508 |
| Daily Fibonacci 38.2% | 1.3529 |
| Daily Fibonacci 61.8% | 1.3543 |
| Daily Pivot Point S1 | 1.3496 |
| Daily Pivot Point S2 | 1.3474 |
| Daily Pivot Point S3 | 1.3440 |
| Daily Pivot Point R1 | 1.3553 |
| Daily Pivot Point R2 | 1.3587 |
| Daily Pivot Point R3 | 1.3610 |
[/s2If]
Join Our Telegram Group


