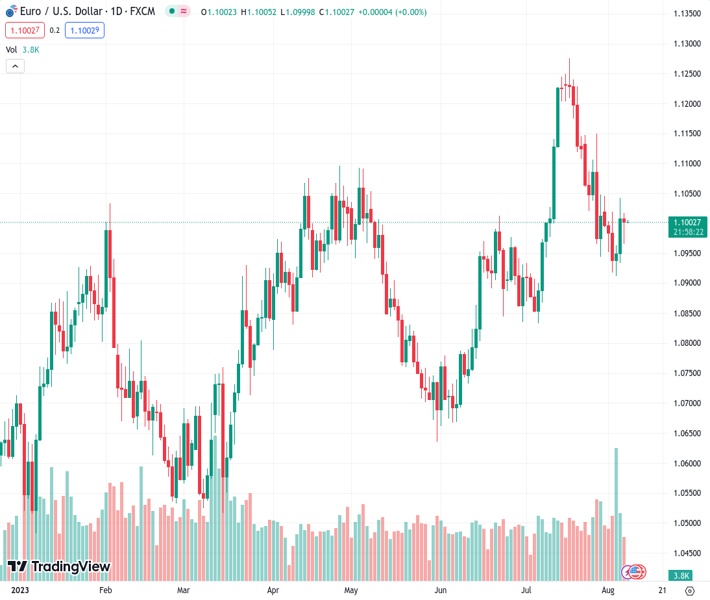
The EURUSD pair is staying stagnant at 1.10019, with no significant movement, following a halt to its two-day rebound the day before.
…
This is a premium post.
[s2If !current_user_can(access_s2member_level4)]Please register for FREE REGISTER to read full post below containing analysis. In case of any error or you think you are not able to read the full post below, please email us at support#nehcap.com [lwa][/s2If] [s2If current_user_can(access_s2member_level1)]
- EUR/USD remains sidelined after pausing a two-day recovery the previous day.
The pair currently trades last at 1.10019.
The previous day high was 1.1042 while the previous day low was 1.0935. The daily 38.2% Fib levels comes at 1.1001, expected to provide support. Similarly, the daily 61.8% fib level is at 1.0976, expected to provide support.
EUR/USD treads water around 1.1000 amid the early hours of Tuesday’s Asian session, after probing a two-day uptrend the previous day. It’s worth noting that the US Dollar’s inability to defend the week-start gains contrasts with the recession fears from the bloc, mainly inflicted by German data, to trouble the Euro traders amid a light calendar ahead of this week’s top-tier inflation numbers.
On Monday, the Eurozone Sentix Investor Confidence improved to -18.9 for August from -22.5 in July, versus the market consensus of a -23.4 reading. Following the data, Sentix Managing Director Patrick Hussy termed Germany as the sick man of the Eurozone while also adding, “The economy in the Eurozone remains in recession mode. There can therefore be no joy about this development.”
Further, German Industrial Production figures for June dropped to -1.5% MoM versus -0.4% expected and -0.1% prior (revised) while the non-seasonally adjusted figures marked a 1.7% fall in German IP compared to 0.0% previous readings. During the last week, softer prints of the Eurozone inflation data contrast with an improvement in the bloc’s growth figures to allow the Euro to remain firmer. However, the chatters about the European Central Bank (ECB) peak rates were triggered by the global rating agency Fitch Ratings and weighed on the Euro afterward as it said on Friday that the falling Eurozone inflation puts the ECB rates peak within sight. On the same line was the ECB article which stated that the “underlying inflation likely peaked in the first half of 2023.”
On the other hand, the US Dollar remained firmer on early Monday after the hawkish comments from Federal Reserve (Fed) Governor Michelle Bowman as he said that additional rate increases will likely be needed to lower inflation back to target. However, the greenback dropped afterward as New York Fed President John C. Williams said he expects that interest rates could begin to come down next year. The policymaker also conveyed hopes of witnessing a slightly higher unemployment rate as the economy cooled.
Against this backdrop, Wall Street ended Monday on the positive side while probing the US Treasury bond yields as they consolidated Friday’s heavy fall, which in turn put a floor under the US Dollar and weigh on the EUR/USD. That said, the benchmark US 10-year Treasury bond yields rose to 4.10% by the press time.
Looking ahead, the final readings of Germany’s inflation data for July, per the Harmonized Index of Consumer Prices (HICP) measure, may entertain EUR/USD traders ahead of the US foreign trade numbers for June. Above all, the US Consumer Price Index (CPI) will be important to watch for clear directions as the market’s bets on the Fed’s September rate hike languishes of late.
EUR/USD remains sidelined between the 100-DMA and a downward-sloping resistance line from July 18, respectively near 1.0925 and 1.1010 by the press time.
Technical Levels: Supports and Resistances
EURUSD currently trading at 1.1003 at the time of writing. Pair opened at 1.1009 and is trading with a change of -0.05% % .
| Overview | Overview.1 | |
|---|---|---|
| 0 | Today last price | 1.1003 |
| 1 | Today Daily Change | -0.0006 |
| 2 | Today Daily Change % | -0.05% |
| 3 | Today daily open | 1.1009 |
The pair is trading below its 20 Daily moving average @ 1.108, above its 50 Daily moving average @ 1.0937 , above its 100 Daily moving average @ 1.092 and above its 200 Daily moving average @ 1.0745
| Trends | Trends.1 | |
|---|---|---|
| 0 | Daily SMA20 | 1.1080 |
| 1 | Daily SMA50 | 1.0937 |
| 2 | Daily SMA100 | 1.0920 |
| 3 | Daily SMA200 | 1.0745 |
The previous day high was 1.1042 while the previous day low was 1.0935. The daily 38.2% Fib levels comes at 1.1001, expected to provide support. Similarly, the daily 61.8% fib level is at 1.0976, expected to provide support.
Note the levels of interest below:
- Pivot support is noted at 1.0948, 1.0888, 1.0841
- Pivot resistance is noted at 1.1055, 1.1102, 1.1162
| Levels | Levels.1 |
|---|---|
| Previous Daily High | 1.1042 |
| Previous Daily Low | 1.0935 |
| Previous Weekly High | 1.1046 |
| Previous Weekly Low | 1.0912 |
| Previous Monthly High | 1.1276 |
| Previous Monthly Low | 1.0834 |
| Daily Fibonacci 38.2% | 1.1001 |
| Daily Fibonacci 61.8% | 1.0976 |
| Daily Pivot Point S1 | 1.0948 |
| Daily Pivot Point S2 | 1.0888 |
| Daily Pivot Point S3 | 1.0841 |
| Daily Pivot Point R1 | 1.1055 |
| Daily Pivot Point R2 | 1.1102 |
| Daily Pivot Point R3 | 1.1162 |
[/s2If]
Download Nehcap EAWe have two EAs that are operational on our LIVE accounts.
- EA-FIX: Check out the details here. Download EA-FIX . EA-FIX is a non-grid HFT scalper.
- EA-GROWTH: High quality low dd EA using trend grids. Download EA_GROWTHJoin Our Telegram Group


