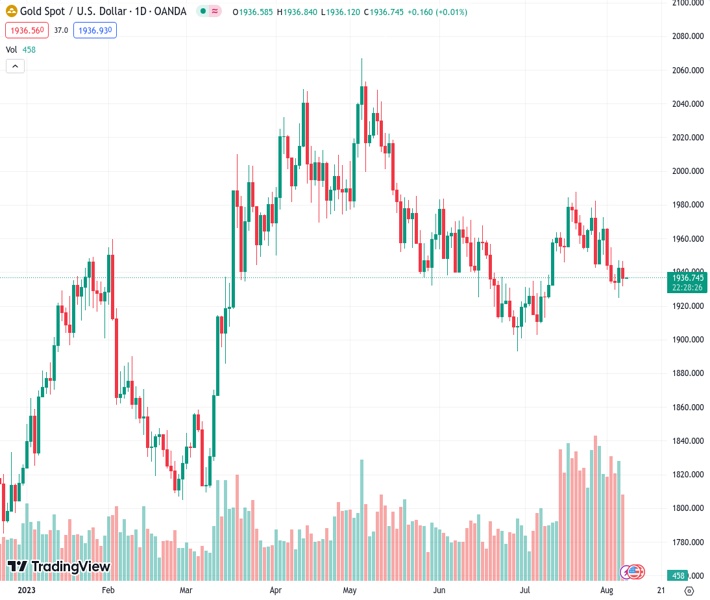
Gold Price at 1,936.50 in XAUUSD continues to weaken due to the strength of the US Dollar, supported by the United States Treasury bond yields, despite the presence of varied economic information. Nehcap anticipates further decline.
…
This is a premium post.
[s2If !current_user_can(access_s2member_level4)]Please register for FREE REGISTER to read full post below containing analysis. In case of any error or you think you are not able to read the full post below, please email us at support#nehcap.com [lwa][/s2If] [s2If current_user_can(access_s2member_level1)]
- Gold Price remains on the back foot as United States Treasury bond yields underpin US Dollar strength despite mixed data.
The pair currently trades last at 1936.50.
The previous day high was 1946.9 while the previous day low was 1925.72. The daily 38.2% Fib levels comes at 1938.81, expected to provide resistance. Similarly, the daily 61.8% fib level is at 1933.81, expected to provide support.
Gold Price (XAU/USD) stays depressed around $1,935 after beginning the trading week with mild losses. That said, the XAU/USD manages to keep the bears on board amid technical breakdown, as well as the firmer prints of the United States Treasury bond yields, despite a sluggish US Dollar ahead of this week’s inflation data from the US and China. Also an absence of major macros and the market’s inaction limits the yellow metal’s immediate moves ahead of top-tier data/events.
Gold Price defends the previous week’s downside break of important supports (read Gold Price Technical Analysis) even if the traders remain inactive during early Monday amid a lack of major data/events, as well as the sluggish US Dollar.
That said, the US Dollar Index (DXY) stays defensive around 102.00 after beginning the week’s trading on a front foot while consolidating Friday’s Nonfarm Payrolls (NFP) inflicted losses.
That said, the US Dollar remained firmer on early Monday after the hawkish comments from Federal Reserve (Fed) Governor Michelle Bowman as he said that additional rate increases will likely be needed to lower inflation back to target. However, the greenback dropped afterward as New York Fed President John C. Williams said he expects that interest rates could begin to come down next year. The policymaker also conveyed hopes of witnessing a slightly higher unemployment rate as the economy cooled.
On a different page, hopes of more stimulus from China jostled with the fears of typhoon Doksuri to also weigh on the Gold Price, due to the dragon nation’s status as one of the major XAU/USD consumers. On Monday, China’s Ministry of Water Resources cited a stronger response for flooding to Level III in Inner Mongolia, Jilin and Heilongjiang while highlighting the recently escalating fears from typhoon Doksuri. The Reuters news also mentioned that China has a four-tier emergency response system, with Level I being the most urgent.
Amid these plays, Wall Street ended Monday on the positive side while probing the US Treasury bond yields as they consolidated Friday’s heavy fall, which in turn put a floor under the US Dollar and weigh on the Gold Price. That said, the benchmark US 10-year Treasury bond yields rose to 4.10% by the press time.
While the firmer US Treasury bond yields defend the US Dollar and weigh on the Gold Price, the traders will seek more clues to defend the moves amid a likely sluggish session moving forward. As a result, today’s foreign trade numbers for China and the United States will be crucial to watch for the XAU/USD traders amid talks of easing economic recovery and challenges for the Federal Reserve (Fed) hawkish, which in turn put a floor under the Gold Price.
Also read: Gold Price Forecast: XAU/USD under pressure and aiming for $1,900
Gold Price retreats from five-week-old rising support-turned-resistance, as well as the 200-Exponential Moving Average (EMA), around $1,950 by the press time.
Adding credence to the downside bias about the XAU/USD price could be the bearish signals from the Moving Average Convergence and Divergence (MACD) indicator, as well as a descending Relative Strength Index (RSI) line, placed at 14, not oversold.
With this, the Gold Price appears well set to revisit the previous weekly low of around $1,925 before declining toward a six-week-long horizontal support zone of around $1,915.
Following that, the monthly low marked in June near $1,893 will be crucial to watch for further directions.
On the contrary, a clear upside break of the aforementioned $1,950 resistance confluence isn’t an open invitation to the Gold buyers as a one-week-old falling resistance line near $1,955 will check the upside momentum. In that case, a horizontal area comprising multiple tops marked since May 19 near $1,985 will be in the spotlight as it holds the gate for the XAU/USD rally past the $2,000 threshold.
Trend: Further downside expected
Technical Levels: Supports and Resistances
XAUUSD currently trading at 1936.66 at the time of writing. Pair opened at 1942.88 and is trading with a change of -0.32% % .
| Overview | Overview.1 | |
|---|---|---|
| 0 | Today last price | 1936.66 |
| 1 | Today Daily Change | -6.22 |
| 2 | Today Daily Change % | -0.32% |
| 3 | Today daily open | 1942.88 |
The pair is trading below its 20 Daily moving average @ 1954.54, below its 50 Daily moving average @ 1945.17 , below its 100 Daily moving average @ 1969.09 and above its 200 Daily moving average @ 1894.9
| Trends | Trends.1 | |
|---|---|---|
| 0 | Daily SMA20 | 1954.54 |
| 1 | Daily SMA50 | 1945.17 |
| 2 | Daily SMA100 | 1969.09 |
| 3 | Daily SMA200 | 1894.90 |
The previous day high was 1946.9 while the previous day low was 1925.72. The daily 38.2% Fib levels comes at 1938.81, expected to provide resistance. Similarly, the daily 61.8% fib level is at 1933.81, expected to provide support.
Note the levels of interest below:
- Pivot support is noted at 1930.1, 1917.32, 1908.92
- Pivot resistance is noted at 1951.28, 1959.68, 1972.46
| Levels | Levels.1 |
|---|---|
| Previous Daily High | 1946.90 |
| Previous Daily Low | 1925.72 |
| Previous Weekly High | 1972.45 |
| Previous Weekly Low | 1925.72 |
| Previous Monthly High | 1987.54 |
| Previous Monthly Low | 1902.77 |
| Daily Fibonacci 38.2% | 1938.81 |
| Daily Fibonacci 61.8% | 1933.81 |
| Daily Pivot Point S1 | 1930.10 |
| Daily Pivot Point S2 | 1917.32 |
| Daily Pivot Point S3 | 1908.92 |
| Daily Pivot Point R1 | 1951.28 |
| Daily Pivot Point R2 | 1959.68 |
| Daily Pivot Point R3 | 1972.46 |
[/s2If]
Download Nehcap EAWe have two EAs that are operational on our LIVE accounts.
- EA-FIX: Check out the details here. Download EA-FIX . EA-FIX is a non-grid HFT scalper.
- EA-GROWTH: High quality low dd EA using trend grids. Download EA_GROWTHJoin Our Telegram Group


