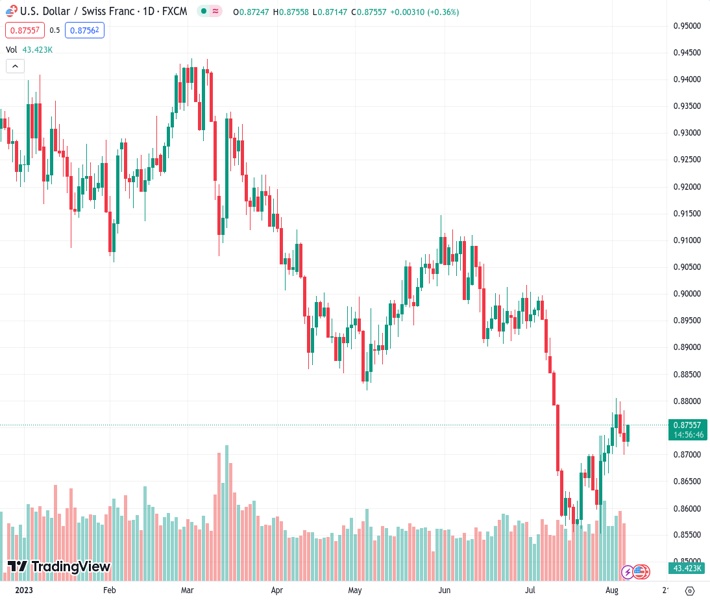
According to the analysis of @nehcap, the USDCHF currency pair has recorded its first daily increase in three days. This comes after a week-long period of following a bearish chart pattern known as a rising wedge. @nehcap is anticipating a potential decrease in value in the near future.
…
This is a premium post.
[s2If !current_user_can(access_s2member_level4)]Please register for FREE REGISTER to read full post below containing analysis. In case of any error or you think you are not able to read the full post below, please email us at support#nehcap.com [lwa][/s2If] [s2If current_user_can(access_s2member_level1)]
- USD/CHF prints the first daily gains in three within one-week-old rising wedge bearish chart pattern.
The pair currently trades last at 0.87549.
The previous day high was 0.8783 while the previous day low was 0.87. The daily 38.2% Fib levels comes at 0.8731, expected to provide support. Similarly, the daily 61.8% fib level is at 0.8751, expected to provide support.
USD/CHF grinds near the intraday high surrounding 0.8755 as it prints the first daily gain in three heading into Monday’s European session. In doing so, the Swiss Franc (CHF) pair extends the previous day’s rebound from the 50-SMA.
Despite the pair’s latest rebound from the 50-SMA, it portrays a fortnight-old rising wedge bearish chart formation, currently between 0.8715 and 0.8840.
However, the bearish MACD signals and the 200-SMA hurdle of 0.8790 restrict the immediate recovery of the USD/CHF pair.
Even if the USD/CHF bulls manage to cross the 0.8840 hurdle and defy the rising wedge bearish chart pattern, a downward-sloping resistance line from May 31, close to 0.8860 at the latest, will act as the last defense of the sellers.
Meanwhile, a clear downside break of the 0.8720–15 support confluence, encompassing the stated wedge’s lower line and the 50-SMA, will recall the USD/CHF bears.
Following that, a slew of lows marked since July 14, close to 0.8565–55, will be in the spotlight as a break which will direct the Swiss Franc pair towards the theoretical target of the rising wedge confirmation, close to 0.8470.
Trend: Pullback expected
Technical Levels: Supports and Resistances
USDCHF currently trading at 0.8746 at the time of writing. Pair opened at 0.8727 and is trading with a change of 0.22% % .
| Overview | Overview.1 | |
|---|---|---|
| 0 | Today last price | 0.8746 |
| 1 | Today Daily Change | 0.0019 |
| 2 | Today Daily Change % | 0.22% |
| 3 | Today daily open | 0.8727 |
The pair is trading above its 20 Daily moving average @ 0.8684, below its 50 Daily moving average @ 0.8873 , below its 100 Daily moving average @ 0.8944 and below its 200 Daily moving average @ 0.9155
| Trends | Trends.1 | |
|---|---|---|
| 0 | Daily SMA20 | 0.8684 |
| 1 | Daily SMA50 | 0.8873 |
| 2 | Daily SMA100 | 0.8944 |
| 3 | Daily SMA200 | 0.9155 |
The previous day high was 0.8783 while the previous day low was 0.87. The daily 38.2% Fib levels comes at 0.8731, expected to provide support. Similarly, the daily 61.8% fib level is at 0.8751, expected to provide support.
Note the levels of interest below:
- Pivot support is noted at 0.869, 0.8653, 0.8607
- Pivot resistance is noted at 0.8773, 0.8819, 0.8856
| Levels | Levels.1 |
|---|---|
| Previous Daily High | 0.8783 |
| Previous Daily Low | 0.8700 |
| Previous Weekly High | 0.8806 |
| Previous Weekly Low | 0.8665 |
| Previous Monthly High | 0.9005 |
| Previous Monthly Low | 0.8552 |
| Daily Fibonacci 38.2% | 0.8731 |
| Daily Fibonacci 61.8% | 0.8751 |
| Daily Pivot Point S1 | 0.8690 |
| Daily Pivot Point S2 | 0.8653 |
| Daily Pivot Point S3 | 0.8607 |
| Daily Pivot Point R1 | 0.8773 |
| Daily Pivot Point R2 | 0.8819 |
| Daily Pivot Point R3 | 0.8856 |
[/s2If]
Download Nehcap EAWe have two EAs that are operational on our LIVE accounts.
- EA-FIX: Check out the details here. Download EA-FIX . EA-FIX is a non-grid HFT scalper.
- EA-GROWTH: High quality low dd EA using trend grids. Download EA_GROWTHJoin Our Telegram Group


