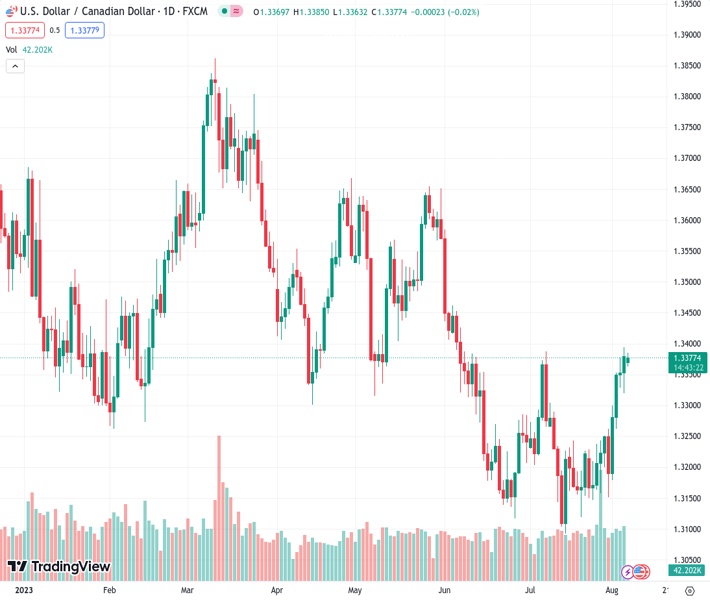
The USDCAD currency pair, currently at a two-month high of 1.33788, is looking for clear signals as both bullish and bearish traders compete following a four-day upward trend.
…
This is a premium post.
[s2If !current_user_can(access_s2member_level4)]Please register for FREE REGISTER to read full post below containing analysis. In case of any error or you think you are not able to read the full post below, please email us at support#nehcap.com [lwa][/s2If] [s2If current_user_can(access_s2member_level1)]
- USD/CAD seeks clear directions at two-month high as bulls and bears jostle after four-day uptrend.
The pair currently trades last at 1.33788.
The previous day high was 1.3394 while the previous day low was 1.332. The daily 38.2% Fib levels comes at 1.3366, expected to provide support. Similarly, the daily 61.8% fib level is at 1.3348, expected to provide support.
USD/CAD aptly portrays the market’s indecision ahead of the all-important US inflation data as it prods bulls at the highest levels in nearly four months, making rounds to 1.3375-80 heading into Monday’s European session. In doing so, the Loonie pair also justifies the latest retreat in the WTI crude oil price, Canada’s key export item, as well as the US Dollar’s recovery.
WTI crude oil refreshed a two-month high near $83.00 before recently retreating to $82.30. The chatters about Saudi Arabia and Russia-inflicted supply crunch joined the OPEC+ decision to keep the output cuts intact propels the Oil price. However, the latest fears emanating from China’s typhoon Doksuri weigh on black gold prices.
On the other hand, the US Dollar Index’s (DXY) ability to snap a two-day downtrend with mild gains around 102.20 favored the Loonie pair to stay on the bull’s radar. It’s worth noting that the comparatively better US jobs report and hawkish Fed talks underpin the USD/CAD run-up even if the firmer Oil price cap the Loonie pair’s latest run-up.
On Friday, Canada’s headline Net Change in Employment slumps to -6.4K in July versus 21.1K market forecasts and 59.9K prior whereas the Unemployment Rate edged higher to 5.5% while matching forecasts, compared to 5.4% prior for July. That said, the US employment report posted a softer-than-expected Nonfarm Payrolls (NFP) figure of 187K, versus 185K prior (revised) and 200K market forecasts, whereas the Unemployment Rate eased to 3.5% from 3.6% expected and previous readings. Further, the Average Hourly Earnings reprinted 0.4% MoM and 4.4% YoY numbers by defying the expectations of witnessing a slight reduction in wage growth.
Despite the mixed US data, the hawkish comments from Federal Reserve (Fed) Governor Michelle Bowman might have limited USD/CAD fall as she said that the Fed should remain willing to raise the federal funds rate at a future meeting if the incoming data indicate that progress on inflation has stalled. Previously, Atlanta Federal Reserve Bank President Raphael Bostic said on Friday to Bloomberg, that the central bank is likely to keep monetary policy in a restrictive territory well into 2024. On the contrary, Chicago Fed President Austan Goolsbee stated that they should start thinking about how long to hold rates.
Looking forward, the Canadian economic calendar appears mostly silent, apart from the second-tier housing and trade numbers, which in turn highlights this week’s US Consumer Price Index (CPI) and Producer Price Index (PPI) for July for clear directions. Should the US inflation data suggest escalating price pressure, the USD/CAD bulls can dominate further.
A clear upside break of the 100 and 200-day Exponential Moving Average (EMA), around 1.3360-55 by the press time, keeps USD/CAD buyers hopeful even if the nearly overbought RSI prods the upside momentum of late.
Technical Levels: Supports and Resistances
USDCAD currently trading at 1.3377 at the time of writing. Pair opened at 1.3378 and is trading with a change of -0.01% % .
| Overview | Overview.1 | |
|---|---|---|
| 0 | Today last price | 1.3377 |
| 1 | Today Daily Change | -0.0001 |
| 2 | Today Daily Change % | -0.01% |
| 3 | Today daily open | 1.3378 |
The pair is trading above its 20 Daily moving average @ 1.3227, above its 50 Daily moving average @ 1.3279 , below its 100 Daily moving average @ 1.3402 and below its 200 Daily moving average @ 1.3456
| Trends | Trends.1 | |
|---|---|---|
| 0 | Daily SMA20 | 1.3227 |
| 1 | Daily SMA50 | 1.3279 |
| 2 | Daily SMA100 | 1.3402 |
| 3 | Daily SMA200 | 1.3456 |
The previous day high was 1.3394 while the previous day low was 1.332. The daily 38.2% Fib levels comes at 1.3366, expected to provide support. Similarly, the daily 61.8% fib level is at 1.3348, expected to provide support.
Note the levels of interest below:
- Pivot support is noted at 1.3334, 1.3289, 1.3259
- Pivot resistance is noted at 1.3408, 1.3439, 1.3483
| Levels | Levels.1 |
|---|---|
| Previous Daily High | 1.3394 |
| Previous Daily Low | 1.3320 |
| Previous Weekly High | 1.3394 |
| Previous Weekly Low | 1.3151 |
| Previous Monthly High | 1.3387 |
| Previous Monthly Low | 1.3093 |
| Daily Fibonacci 38.2% | 1.3366 |
| Daily Fibonacci 61.8% | 1.3348 |
| Daily Pivot Point S1 | 1.3334 |
| Daily Pivot Point S2 | 1.3289 |
| Daily Pivot Point S3 | 1.3259 |
| Daily Pivot Point R1 | 1.3408 |
| Daily Pivot Point R2 | 1.3439 |
| Daily Pivot Point R3 | 1.3483 |
[/s2If]
Download Nehcap EAWe have two EAs that are operational on our LIVE accounts.
- EA-FIX: Check out the details here. Download EA-FIX . EA-FIX is a non-grid HFT scalper.
- EA-GROWTH: High quality low dd EA using trend grids. Download EA_GROWTHJoin Our Telegram Group


