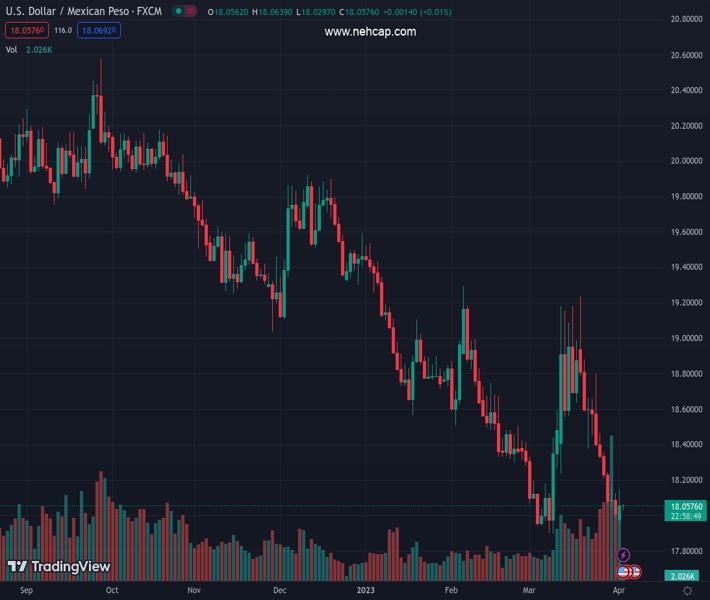
#USDMXN @ 18.0529 US Manufacturing PMI data reveals recessionary signs as business activity contracts. (Pivot Orderbook analysis)
…
This is a premium post.
[s2If !current_user_can(access_s2member_level4)]Please register for PREMIUM VERSION HERE to read full post below containing analysis. In case of any error or you think you are not able to read the full post below, please email us at support#nehcap.com [lwa][/s2If] [s2If current_user_can(access_s2member_level4)]
- US Manufacturing PMI data reveals recessionary signs as business activity contracts.
- US Treasury bond yields fall sharply as odds for another rate hike remain uncertain.
- Strong PMI reading indicates continued growth in Mexico’s manufacturing sector.
The pair currently trades last at 18.0529.
The previous day high was 18.1246 while the previous day low was 17.99. The daily 38.2% Fib levels comes at 18.0414, expected to provide support. Similarly, the daily 61.8% fib level is at 18.0732, expected to provide resistance.
USD/MXN climbs back above the 18.0000 thresholds after testing four-week lows around 17.9644 in the early North American session. Despite broad US Dollar (USD) weakness, outward flows from the emerging markets currency weakened the Mexican Peso (MXN). At the time of writing, the USD/MXN is trading at 18.0420.
Wall Street closed with gains, except for the heavy tech Nasdaq 100. US Treasury bond yields fell sharply, as odds for another rate hike lie at 52.4%. However, money market futures are already pricing in two rate cuts by the end of 2023.
Earlier data showed a slew of Manufacturing PMI data for the United States (US) flashed recessionary signs in the US. The S&P Global and ISM revealed that business activity contracted, with the latter decreasing to 46.3 in March, below the forecast of around 47.5. The gauge plummeted to its lowest since May 2020, weighed by worse-than-estimated new orders and employment measures.
The greenback continued to extend its losses, as the US Dollar Index fell 0.52% to 102.063. US
Consequently, the greenback erased some of its earlier gains, bolstered by higher oil prices. The US Dollar Index (DXY), which tracks the buck’s value vs. a basket of six currencies, slides from 103.05 to 102.20, down 0.38%.
On the Mexican front, Business Confidence in Mexico rose to 52.9, above February’s 52.1. The S&P Global Manufacturing PMI for March registered 51.6 points. In the last 32 months (since August 2020), the indicator has been above 50 points, which is still the expansion zone.
From a technical perspective, the USD/MXN remains neutral to downward biased. Although Monday’s price action was bullish, an inverted hammer, preceded by a downtrend and a daily close around the previous candle mid-point, could open the door for further downside. Therefore, the USD/MXN first support would be the 18.0000 mark. Breach of the latter will expose the YTD low of 17.8968, followed by 17.5000.
Technical Levels: Supports and Resistances
USDMXN currently trading at 18.0678 at the time of writing. Pair opened at 18.025 and is trading with a change of 0.24 % .
| Overview | Overview.1 | |
|---|---|---|
| 0 | Today last price | 18.0678 |
| 1 | Today Daily Change | 0.0428 |
| 2 | Today Daily Change % | 0.2400 |
| 3 | Today daily open | 18.0250 |
The pair remains strongly bearish on the daily time frame. It trades below the 20 SMA @ 18.4438, 50 SMA 18.5308, 100 SMA @ 18.9507 and 200 SMA @ 19.5319.
| Trends | Trends.1 | |
|---|---|---|
| 0 | Daily SMA20 | 18.4438 |
| 1 | Daily SMA50 | 18.5308 |
| 2 | Daily SMA100 | 18.9507 |
| 3 | Daily SMA200 | 19.5319 |
The previous day high was 18.1246 while the previous day low was 17.99. The daily 38.2% Fib levels comes at 18.0414, expected to provide support. Similarly, the daily 61.8% fib level is at 18.0732, expected to provide resistance.
Note the levels of interest below:
- Pivot support is noted at 17.9685, 17.912, 17.8339
- Pivot resistance is noted at 18.103, 18.1811, 18.2376
| Levels | Levels.1 |
|---|---|
| Previous Daily High | 18.1246 |
| Previous Daily Low | 17.9900 |
| Previous Weekly High | 18.4681 |
| Previous Weekly Low | 17.9900 |
| Previous Monthly High | 19.2324 |
| Previous Monthly Low | 17.8977 |
| Daily Fibonacci 38.2% | 18.0414 |
| Daily Fibonacci 61.8% | 18.0732 |
| Daily Pivot Point S1 | 17.9685 |
| Daily Pivot Point S2 | 17.9120 |
| Daily Pivot Point S3 | 17.8339 |
| Daily Pivot Point R1 | 18.1030 |
| Daily Pivot Point R2 | 18.1811 |
| Daily Pivot Point R3 | 18.2376 |
[/s2If]
Join Our Telegram Group


