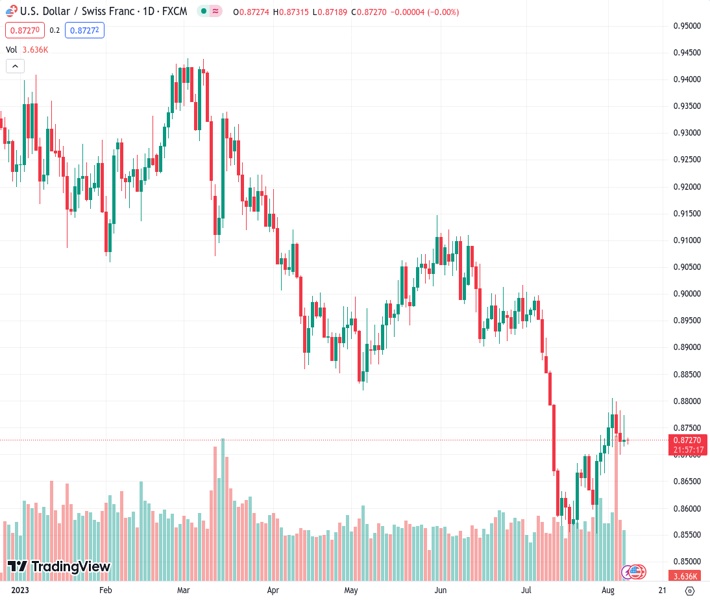
The USDCHF pair reached a value of 0.87271 and displayed a bearish-harami candlestick pattern. However, it was unable to continue decreasing below the low point of the previous week.
…
This is a premium post.
[s2If !current_user_can(access_s2member_level4)]Please register for FREE REGISTER to read full post below containing analysis. In case of any error or you think you are not able to read the full post below, please email us at support#nehcap.com [lwa][/s2If] [s2If current_user_can(access_s2member_level1)]
- USD/CHF printed a ‘bearish-harami’ candlestick pattern but failed to extend its losses past the last week’s low.
The pair currently trades last at 0.87271.
The previous day high was 0.8783 while the previous day low was 0.87. The daily 38.2% Fib levels comes at 0.8731, expected to provide resistance. Similarly, the daily 61.8% fib level is at 0.8751, expected to provide resistance.
USD/CHF held to minimal gains of 0.03% on Monday, seesaws above/below the 20-day Exponential Moving Average (EMA) of 0.8731 as the Asian session begins. Nevertheless, the USD/CHF remains in a downtrend, and exchanges hands at 0.8726, down 0.01%.
After forming a ‘bearish-harami’ candlestick chart pattern, the USD/CHF resumed its downtrend last Thursday, but Monday’s price action forming a ‘gravestone-doji’ portrays traders’ indecision about extending its losses toward last week’s low of 0.8699.
If USD/CHF drops below the latter, the pair might extend its losses toward the year-to-date (YTD) low of 0.8554, threatening to extend its plunge toward the 0.8500 figure. Conversely, if USD/CHF buyers reclaim the 20-day EMA, that could pave the way for further upside.
First resistance would emerge at the 0.8800 figure. Once buyers conquer that level, up next would be the May 4 low-turned resistance at 0.8819, followed by the 0.8900 mark.
Technical Levels: Supports and Resistances
USDCHF currently trading at 0.8726 at the time of writing. Pair opened at 0.8727 and is trading with a change of -0.01 % .
| Overview | Overview.1 | |
|---|---|---|
| 0 | Today last price | 0.8726 |
| 1 | Today Daily Change | -0.0001 |
| 2 | Today Daily Change % | -0.0100 |
| 3 | Today daily open | 0.8727 |
The pair is trading above its 20 Daily moving average @ 0.8684, below its 50 Daily moving average @ 0.8873 , below its 100 Daily moving average @ 0.8944 and below its 200 Daily moving average @ 0.9155
| Trends | Trends.1 | |
|---|---|---|
| 0 | Daily SMA20 | 0.8684 |
| 1 | Daily SMA50 | 0.8873 |
| 2 | Daily SMA100 | 0.8944 |
| 3 | Daily SMA200 | 0.9155 |
The previous day high was 0.8783 while the previous day low was 0.87. The daily 38.2% Fib levels comes at 0.8731, expected to provide resistance. Similarly, the daily 61.8% fib level is at 0.8751, expected to provide resistance.
Note the levels of interest below:
- Pivot support is noted at 0.869, 0.8653, 0.8607
- Pivot resistance is noted at 0.8773, 0.8819, 0.8856
| Levels | Levels.1 |
|---|---|
| Previous Daily High | 0.8783 |
| Previous Daily Low | 0.8700 |
| Previous Weekly High | 0.8806 |
| Previous Weekly Low | 0.8665 |
| Previous Monthly High | 0.9005 |
| Previous Monthly Low | 0.8552 |
| Daily Fibonacci 38.2% | 0.8731 |
| Daily Fibonacci 61.8% | 0.8751 |
| Daily Pivot Point S1 | 0.8690 |
| Daily Pivot Point S2 | 0.8653 |
| Daily Pivot Point S3 | 0.8607 |
| Daily Pivot Point R1 | 0.8773 |
| Daily Pivot Point R2 | 0.8819 |
| Daily Pivot Point R3 | 0.8856 |
[/s2If]
Download Nehcap EAWe have two EAs that are operational on our LIVE accounts.
- EA-FIX: Check out the details here. Download EA-FIX . EA-FIX is a non-grid HFT scalper.
- EA-GROWTH: High quality low dd EA using trend grids. Download EA_GROWTHJoin Our Telegram Group


