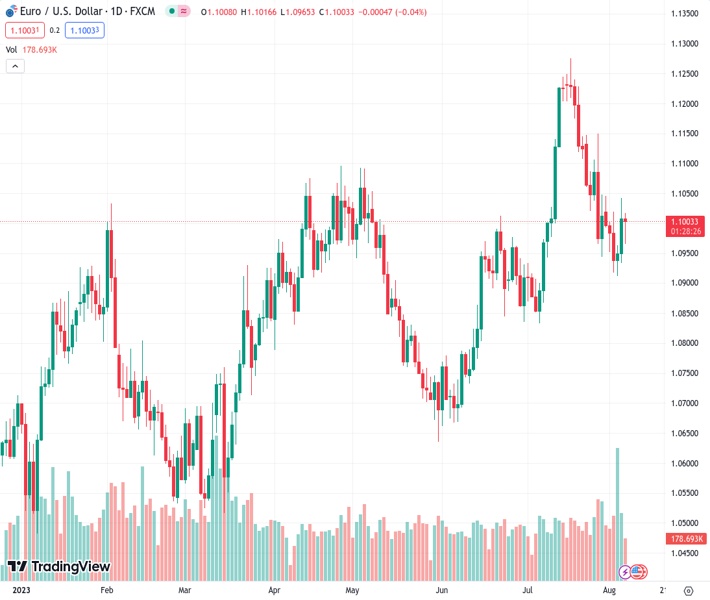
The EURUSD pair, at a price of 1.10048, is still unable to break through the important resistance zone of 1.1000/1.1018. This is due to obstacles presented by the 20-day Exponential Moving Average and a resistance trendline that has been in place for one month.
…
This is a premium post.
[s2If !current_user_can(access_s2member_level4)]Please register for FREE REGISTER to read full post below containing analysis. In case of any error or you think you are not able to read the full post below, please email us at support#nehcap.com [lwa][/s2If] [s2If current_user_can(access_s2member_level1)]
- EUR/USD remains below the key 1.1000/1.1018 resistance area, hindered by the 20-day EMA and a one-month-old resistance trendline.
The pair currently trades last at 1.10048.
The previous day high was 1.1042 while the previous day low was 1.0935. The daily 38.2% Fib levels comes at 1.1001, expected to provide support. Similarly, the daily 61.8% fib level is at 1.0976, expected to provide support.
The EUR/USD erases some of its earlier losses but remains capped by the 20-day Exponential Moving Average (EMA) intersection with a resistance trendline at around the 1.1000/1.1018 area. The EUR/USD exchanges hands at 1.1007, down 0.01% ahead of the Wall Street close.
From a daily chart perspective, the EUR/USD should be headed upward as a ‘morning-star’ three-candlestick chart pattern emerges. But Monday’s price action forming a doji indicates buyers are struggling to gather momentum, which could lose control to sellers if the EUR/USD falls below 1.1000.
From a short-term standpoint, the EUR/USD is tilted upward, but a one-month-old resistance trendline would be difficult to surpass as the pair edges higher. A breach of 1.1020 will put into play the R1 daily pivot at 1.1055, followed by the April 26 high at 1.1095 ahead of 1.1100.
On the other hand, if EUR/USD tumbles below 1.1000, the following support would be the S1 pivot point at 1.0947, followed by last Friday’s low of 1.0933. Failure to crack the latter could spark an upward correction, as the EUR/USD could fail to achieve a new lower low. A continuation could pave the way to challenge 1.0900.
Technical Levels: Supports and Resistances
EURUSD currently trading at 1.1006 at the time of writing. Pair opened at 1.1009 and is trading with a change of -0.03 % .
| Overview | Overview.1 | |
|---|---|---|
| 0 | Today last price | 1.1006 |
| 1 | Today Daily Change | -0.0003 |
| 2 | Today Daily Change % | -0.0300 |
| 3 | Today daily open | 1.1009 |
The pair is trading below its 20 Daily moving average @ 1.108, above its 50 Daily moving average @ 1.0937 , above its 100 Daily moving average @ 1.092 and above its 200 Daily moving average @ 1.0745
| Trends | Trends.1 | |
|---|---|---|
| 0 | Daily SMA20 | 1.1080 |
| 1 | Daily SMA50 | 1.0937 |
| 2 | Daily SMA100 | 1.0920 |
| 3 | Daily SMA200 | 1.0745 |
The previous day high was 1.1042 while the previous day low was 1.0935. The daily 38.2% Fib levels comes at 1.1001, expected to provide support. Similarly, the daily 61.8% fib level is at 1.0976, expected to provide support.
Note the levels of interest below:
- Pivot support is noted at 1.0948, 1.0888, 1.0841
- Pivot resistance is noted at 1.1055, 1.1102, 1.1162
| Levels | Levels.1 |
|---|---|
| Previous Daily High | 1.1042 |
| Previous Daily Low | 1.0935 |
| Previous Weekly High | 1.1046 |
| Previous Weekly Low | 1.0912 |
| Previous Monthly High | 1.1276 |
| Previous Monthly Low | 1.0834 |
| Daily Fibonacci 38.2% | 1.1001 |
| Daily Fibonacci 61.8% | 1.0976 |
| Daily Pivot Point S1 | 1.0948 |
| Daily Pivot Point S2 | 1.0888 |
| Daily Pivot Point S3 | 1.0841 |
| Daily Pivot Point R1 | 1.1055 |
| Daily Pivot Point R2 | 1.1102 |
| Daily Pivot Point R3 | 1.1162 |
[/s2If]
Download Nehcap EAWe have two EAs that are operational on our LIVE accounts.
- EA-FIX: Check out the details here. Download EA-FIX . EA-FIX is a non-grid HFT scalper.
- EA-GROWTH: High quality low dd EA using trend grids. Download EA_GROWTHJoin Our Telegram Group


