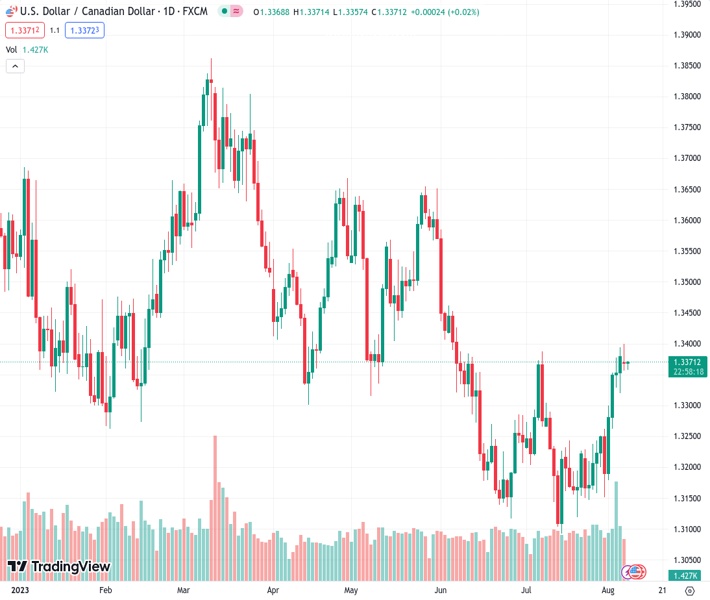
The USDCAD pair finished the day with a neutral closing, slightly higher than its opening price at 1.3370, following a peak of 1.3399 during the day.
…
This is a premium post.
[s2If !current_user_can(access_s2member_level4)]Please register for FREE REGISTER to read full post below containing analysis. In case of any error or you think you are not able to read the full post below, please email us at support#nehcap.com [lwa][/s2If] [s2If current_user_can(access_s2member_level1)]
- The USD/CAD closed neutral, just above its opening price at 1.3370 after hitting a daily high of 1.3399.
The pair currently trades last at 1.33689.
The previous day high was 1.3394 while the previous day low was 1.332. The daily 38.2% Fib levels comes at 1.3366, expected to provide support. Similarly, the daily 61.8% fib level is at 1.3348, expected to provide support.
The USD/CAD closed flat at the 1.3370 zone after getting rejected at the 100-day Simple Moving Average (SMA) of 1.3395 at the end of Monday’s session. On the one hand, the US Dollar strengthened on the back of rising US yields while lower Oil prices limited the CAD’s advance.
At the start of the week, no relevant data was released, and markets continued to assess Friday’s Nonfarm Payrolls (NFPs) from the US in July. The data showed that job creation slowed and wages increased, but markets dumped the USD on the lower-than-expected NFPs. During the session, the Greenback re-gained ground against its rivals as the US Treasury yields recovered, with the 10-year rate jumping more than 1% to 4.09% after significantly declining on Friday and pushing the pair upwards.
All eyes are now on Consumer Price Index (CPI) figures from July, where markets foresee the headline figure accelerating but the core measure decelerating.
On the CAD’s front, the Canadian calendar had nothing relevant to offer. The decrease of the West Texas Intermediate (WTI) and Brent barrels added pressure over the Loonie through the session.
Observing the daily chart, it is apparent that USD/CAD is experiencing a neutral to bearish trend as the bulls struggle to maintain their momentum. The Relative Strength Index (RSI) has a negative slope above its midline, while the Moving Average Convergence (MACD) prints lower green bars. Moreover, the pair is above the 20-day Simple Moving Average (SMA) but below the 100 and 200-day SMAs, indicating that despite still being some light for the bulls, the bears have the upper hand in the broader context.
Support levels: 1.3330, 1.3315, 1.3300.
Resistance levels: 1.3395 (100-day SMA), 1.3440, 1.3450 (200-day SMA).
Technical Levels: Supports and Resistances
USDCAD currently trading at 1.3372 at the time of writing. Pair opened at 1.3378 and is trading with a change of -0.04 % .
| Overview | Overview.1 | |
|---|---|---|
| 0 | Today last price | 1.3372 |
| 1 | Today Daily Change | -0.0006 |
| 2 | Today Daily Change % | -0.0400 |
| 3 | Today daily open | 1.3378 |
The pair is trading above its 20 Daily moving average @ 1.3227, above its 50 Daily moving average @ 1.3279 , below its 100 Daily moving average @ 1.3402 and below its 200 Daily moving average @ 1.3456
| Trends | Trends.1 | |
|---|---|---|
| 0 | Daily SMA20 | 1.3227 |
| 1 | Daily SMA50 | 1.3279 |
| 2 | Daily SMA100 | 1.3402 |
| 3 | Daily SMA200 | 1.3456 |
The previous day high was 1.3394 while the previous day low was 1.332. The daily 38.2% Fib levels comes at 1.3366, expected to provide support. Similarly, the daily 61.8% fib level is at 1.3348, expected to provide support.
Note the levels of interest below:
- Pivot support is noted at 1.3334, 1.3289, 1.3259
- Pivot resistance is noted at 1.3408, 1.3439, 1.3483
| Levels | Levels.1 |
|---|---|
| Previous Daily High | 1.3394 |
| Previous Daily Low | 1.3320 |
| Previous Weekly High | 1.3394 |
| Previous Weekly Low | 1.3151 |
| Previous Monthly High | 1.3387 |
| Previous Monthly Low | 1.3093 |
| Daily Fibonacci 38.2% | 1.3366 |
| Daily Fibonacci 61.8% | 1.3348 |
| Daily Pivot Point S1 | 1.3334 |
| Daily Pivot Point S2 | 1.3289 |
| Daily Pivot Point S3 | 1.3259 |
| Daily Pivot Point R1 | 1.3408 |
| Daily Pivot Point R2 | 1.3439 |
| Daily Pivot Point R3 | 1.3483 |
[/s2If]
Download Nehcap EAWe have two EAs that are operational on our LIVE accounts.
- EA-FIX: Check out the details here. Download EA-FIX . EA-FIX is a non-grid HFT scalper.
- EA-GROWTH: High quality low dd EA using trend grids. Download EA_GROWTHJoin Our Telegram Group


