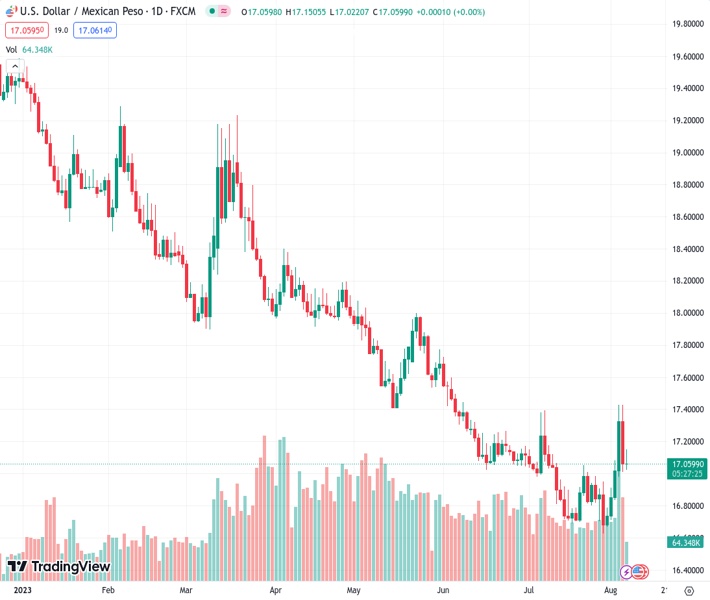
The US dollar to Mexican peso exchange rate is at 17.0528. The employment report for July showed that the number of jobs created was 187,000, slightly lower than the anticipated 200,000. However, there was a positive development as Average Hourly Earnings rose by 4.4% compared to the previous year, which suggests a potential increase in wages.
…
This is a premium post.
[s2If !current_user_can(access_s2member_level4)]Please register for FREE REGISTER to read full post below containing analysis. In case of any error or you think you are not able to read the full post below, please email us at support#nehcap.com [lwa][/s2If] [s2If current_user_can(access_s2member_level1)]
- July’s Nonfarm Payrolls came in at 187K, below the expected 200K. However, Average Hourly Earnings increased to 4.4% YoY, hinting at possible wage pressure.
The pair currently trades last at 17.0528.
The previous day high was 17.4274 while the previous day low was 17.009. The daily 38.2% Fib levels comes at 17.1688, expected to provide resistance. Similarly, the daily 61.8% fib level is at 17.2675, expected to provide resistance.
USD/MXN recovers some ground on Monday, still trading off the day’s highs of 17.1505, and holds above its opening price by 0.03%. At the time of writing, the USD/MXN exchanges hands at 17.0649 after hitting a daily low of 17.0220.
US equities are trading in the green following a mixed US jobs report last Friday. Even though July’s Nonfarm Payrolls coming below estimates of 200K at 187K shows the labor market is cooling, Average Hourly Earnings (AHE) ticking from 4.2% to 4.4% YoY, shows that wage pressure could reignite a rise in inflation, which, would be revealed by the US Department of Labor on August 10.
Estimates for the Consumer Price Index (CPI) in the United States (US) depict inflation falling to 3% from 3.3% in June, while Core CPI, which strips out volatile items, is estimated to decelerate to 4.7% YoY, from 4.8% in June.
The USD/MXN uptick on Monday is courtesy of hawkish comments by Michelle Bowman, who said the Fed would likely need to lift rates further to bring down inflation. On the dovish side of the spectrum, the New York Fed President John Williams noted that rate cuts could begin in early 2024, depending on economic data and if the inflation trend continued to edge lower.
The US Dollar Index (DXY), a gauge of the buck’s value vs. a basket of six peers, clings to gains of 0.09% at 102.100, a tailwind for the USD/MXN. One of the reasons behind the US Dollar (USD) strength is that US Treasury bond yields are recovering some ground, with the US 10-year benchmark note rate at 4.082%, up two bps.
On the Mexican front, the economic docket reported Consumer Confidence for July at 46.2, exceeding forecasts of 44.9 and above June’s upward-revised figure of 45.3. Ahead of the week, Mexico’s CPI will be revealed on August 9. Forecasts for CPI stand at 4.78% YoY, while for month-over-month, is expected at 0.48%. Softness on inflation data would prevent the Bank of Mexico (Banxico) from tightening conditions after three successive meetings to keep rates unchanged.
Commerzbank analysts reviewed its forecasts for the USD/MXN towards the end of the year, estimating the USD/MXN would be around 17.2000. They added, “The weakening US economy and political risks are likely to weigh on the peso.” They estimate the USD/MXN would hit 17.6000 ahead of the Mexican US general elections and at 18.0000 toward the end of 2024.
The USD/MXN remains downward biased, but a ‘double-bottom’ chart pattern formed around the year’s lows could open the door for further upside. Resistance levels emerge at a four-month-old resistance trendline passing around 17.40, followed on the upside by the 100-day Exponential Moving Average (EMA) at 17.5093. If USD/MXN buyers clear those two resistance levels, the pair could challenge the psychological 18.00 price level, followed by the 200-day EMAat 18.1306. On the downside, the USD/MXN falling below 17.0000 could put into play a re-test of the year-to-date (YTD) low of 16.6238.
Technical Levels: Supports and Resistances
USDMXN currently trading at 17.0634 at the time of writing. Pair opened at 17.09 and is trading with a change of -0.16 % .
| Overview | Overview.1 | |
|---|---|---|
| 0 | Today last price | 17.0634 |
| 1 | Today Daily Change | -0.0266 |
| 2 | Today Daily Change % | -0.1600 |
| 3 | Today daily open | 17.0900 |
The pair is trading above its 20 Daily moving average @ 16.8961, below its 50 Daily moving average @ 17.1098 , below its 100 Daily moving average @ 17.5603 and below its 200 Daily moving average @ 18.3153
| Trends | Trends.1 | |
|---|---|---|
| 0 | Daily SMA20 | 16.8961 |
| 1 | Daily SMA50 | 17.1098 |
| 2 | Daily SMA100 | 17.5603 |
| 3 | Daily SMA200 | 18.3153 |
The previous day high was 17.4274 while the previous day low was 17.009. The daily 38.2% Fib levels comes at 17.1688, expected to provide resistance. Similarly, the daily 61.8% fib level is at 17.2675, expected to provide resistance.
Note the levels of interest below:
- Pivot support is noted at 16.9235, 16.757, 16.5051
- Pivot resistance is noted at 17.3419, 17.5938, 17.7603
| Levels | Levels.1 |
|---|---|
| Previous Daily High | 17.4274 |
| Previous Daily Low | 17.0090 |
| Previous Weekly High | 17.4274 |
| Previous Weekly Low | 16.6694 |
| Previous Monthly High | 17.3957 |
| Previous Monthly Low | 16.6258 |
| Daily Fibonacci 38.2% | 17.1688 |
| Daily Fibonacci 61.8% | 17.2675 |
| Daily Pivot Point S1 | 16.9235 |
| Daily Pivot Point S2 | 16.7570 |
| Daily Pivot Point S3 | 16.5051 |
| Daily Pivot Point R1 | 17.3419 |
| Daily Pivot Point R2 | 17.5938 |
| Daily Pivot Point R3 | 17.7603 |
[/s2If]
Download Nehcap EAWe have two EAs that are operational on our LIVE accounts.
- EA-FIX: Check out the details here. Download EA-FIX . EA-FIX is a non-grid HFT scalper.
- EA-GROWTH: High quality low dd EA using trend grids. Download EA_GROWTHJoin Our Telegram Group


