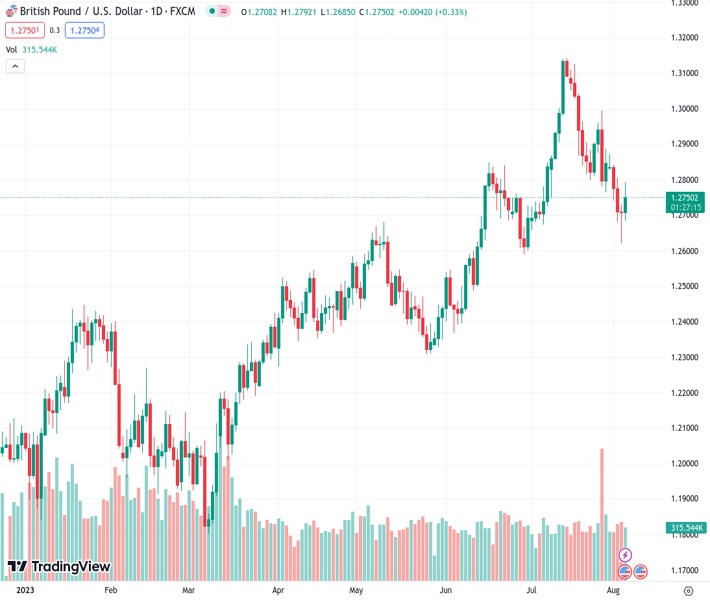
The GBP/USD currency pair is trading at 1.2755, experiencing a 0.34% increase, following the release of underwhelming US jobs data. This has led to speculation that the Federal Reserve might halt its aggressive monetary tightening, leading to a boost in the value of the British Pound.
…
This is a premium post.
[s2If !current_user_can(access_s2member_level4)]Please register for FREE REGISTER to read full post below containing analysis. In case of any error or you think you are not able to read the full post below, please email us at support#nehcap.com [lwa][/s2If] [s2If current_user_can(access_s2member_level1)]
- GBP/USD rises 0.34%, trading at 1.2755, as soft US jobs data fuels speculation the Fed may end its tightening cycle, providing support to the Sterling.
The pair currently trades last at 1.27504.
The previous day high was 1.2728 while the previous day low was 1.2621. The daily 38.2% Fib levels comes at 1.2662, expected to provide support. Similarly, the daily 61.8% fib level is at 1.2687, expected to provide support.
GBP/USD registered modest gains on Friday after a soft US jobs data report spurred speculations the US Federal Reserve (Fed) might end its tightening cycle. Nevertheless, failure to crack the 1.2800 figure would likely keep the Sterling (GBP) pressured in the medium term. The GBP/USD trades at 1.2755, a gain of 0.34% at the time of writing.
The GBP/USD has been recovering some ground in the last couple of days. Thursday’s price action formed a doji, but Friday’s bullish candlestick remains shy of completing a ‘morning-star’ bullish candlestick pattern, which could indicate further gains in the near term.
The uptrend could resume if GBP/USD achieves a daily close above April 26 daily high at 1.2772, followed by the 1.2800 figure. A breach of the latter will expose the 20-day EMA at 1.2819, followed by the 1.2900 mark. Conversely, the GBP/USD first support would be the 1.2700 figure. The break below will set the stage to test the August 3 daily low of 1.2620, followed by the 100-day Exponential Moving Average (EMA) at 1.2595.
Technical Levels: Supports and Resistances
GBPUSD currently trading at 1.2754 at the time of writing. Pair opened at 1.2709 and is trading with a change of 0.35 % .
| Overview | Overview.1 | |
|---|---|---|
| 0 | Today last price | 1.2754 |
| 1 | Today Daily Change | 0.0045 |
| 2 | Today Daily Change % | 0.3500 |
| 3 | Today daily open | 1.2709 |
The pair is trading below its 20 Daily moving average @ 1.2898, above its 50 Daily moving average @ 1.2728 , above its 100 Daily moving average @ 1.258 and above its 200 Daily moving average @ 1.2311
| Trends | Trends.1 | |
|---|---|---|
| 0 | Daily SMA20 | 1.2898 |
| 1 | Daily SMA50 | 1.2728 |
| 2 | Daily SMA100 | 1.2580 |
| 3 | Daily SMA200 | 1.2311 |
The previous day high was 1.2728 while the previous day low was 1.2621. The daily 38.2% Fib levels comes at 1.2662, expected to provide support. Similarly, the daily 61.8% fib level is at 1.2687, expected to provide support.
Note the levels of interest below:
- Pivot support is noted at 1.2643, 1.2578, 1.2536
- Pivot resistance is noted at 1.2751, 1.2793, 1.2858
| Levels | Levels.1 |
|---|---|
| Previous Daily High | 1.2728 |
| Previous Daily Low | 1.2621 |
| Previous Weekly High | 1.2996 |
| Previous Weekly Low | 1.2763 |
| Previous Monthly High | 1.3142 |
| Previous Monthly Low | 1.2659 |
| Daily Fibonacci 38.2% | 1.2662 |
| Daily Fibonacci 61.8% | 1.2687 |
| Daily Pivot Point S1 | 1.2643 |
| Daily Pivot Point S2 | 1.2578 |
| Daily Pivot Point S3 | 1.2536 |
| Daily Pivot Point R1 | 1.2751 |
| Daily Pivot Point R2 | 1.2793 |
| Daily Pivot Point R3 | 1.2858 |
[/s2If]
Download Nehcap EAWe have two EAs that are operational on our LIVE accounts.
- EA-FIX: Check out the details here. Download EA-FIX . EA-FIX is a non-grid HFT scalper.
- EA-GROWTH: High quality low dd EA using trend grids. Download EA_GROWTHJoin Our Telegram Group


