The EURGBP pair has experienced four consecutive days of gains, resulting in a 0.81% weekly increase. Currently, it is trading at 0.8635 but has been unable to surpass the 100-day EMA level at 0.8655.
…
This is a premium post.
[s2If !current_user_can(access_s2member_level4)]Please register for FREE REGISTER to read full post below containing analysis. In case of any error or you think you are not able to read the full post below, please email us at support#nehcap.com [lwa][/s2If] [s2If current_user_can(access_s2member_level1)]
- EUR/GBP gains for four consecutive days, up 0.81% for the week, trading at 0.8635 but failing to break through the 100-day EMA at 0.8655.
The pair currently trades last at 0.86366.
The previous day high was 0.8656 while the previous day low was 0.8596. The daily 38.2% Fib levels comes at 0.8633, expected to provide support. Similarly, the daily 61.8% fib level is at 0.8619, expected to provide support.
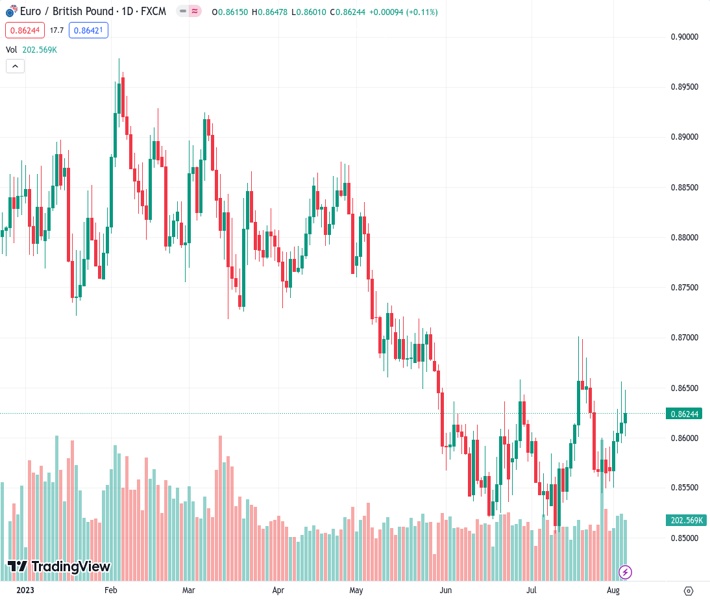
EUR/GBP rallies for the fourth straight day, set to finish the week with gains of 0.81% but failed to crack the 100-day Exponential Moving Average (EMA) of 0.8655, tested on Thursday. The Bank of England’s (BoE) 25 bps rate hike was the reason that capped the EUR/GBP advance, though the EUR/GBP is trading sideways, slightly tilted to the upside. At the time of writing, the EUR/GBP exchanges hands at 0.8635, a gain of 0.23%.
The daily chart portrays the pair forming an inverted head-and-shoulders chart pattern, but EUR/GBP’s price action has failed to decisively break above the 100 and 200-day EMAs at 0.8651 and 0.8671. Nevertheless, further validation is needed, as the EUR/GBP must break above 0.8740/50.
Once that cleared, the EUR/GBP first resistance would be 0.8800. A breach of the latter will expose the May 3 high at 0.8835, followed by the inverted head-and-shoulders minimum profit target of 0.8900. On the flip side, if EUR/GBP drops below the 50-day EMA at 0.8610, that could pave the way for further losses.
The EUR/GBP first support would be 0.8600, closely followed by the 20-day EMA at 0.8595. Once those levels are broken, the next support would emerge at the July 27 daily low of 0.8544, followed by the July 11 daily low of 0.8504.
Technical Levels: Supports and Resistances
EURGBP currently trading at 0.8638 at the time of writing. Pair opened at 0.8616 and is trading with a change of 0.26 % .
| Overview | Overview.1 | |
|---|---|---|
| 0 | Today last price | 0.8638 |
| 1 | Today Daily Change | 0.0022 |
| 2 | Today Daily Change % | 0.2600 |
| 3 | Today daily open | 0.8616 |
The pair is trading above its 20 Daily moving average @ 0.8589, above its 50 Daily moving average @ 0.8589 , below its 100 Daily moving average @ 0.868 and below its 200 Daily moving average @ 0.8725
| Trends | Trends.1 | |
|---|---|---|
| 0 | Daily SMA20 | 0.8589 |
| 1 | Daily SMA50 | 0.8589 |
| 2 | Daily SMA100 | 0.8680 |
| 3 | Daily SMA200 | 0.8725 |
The previous day high was 0.8656 while the previous day low was 0.8596. The daily 38.2% Fib levels comes at 0.8633, expected to provide support. Similarly, the daily 61.8% fib level is at 0.8619, expected to provide support.
Note the levels of interest below:
- Pivot support is noted at 0.8589, 0.8563, 0.853
- Pivot resistance is noted at 0.8649, 0.8682, 0.8708
| Levels | Levels.1 |
|---|---|
| Previous Daily High | 0.8656 |
| Previous Daily Low | 0.8596 |
| Previous Weekly High | 0.8663 |
| Previous Weekly Low | 0.8544 |
| Previous Monthly High | 0.8701 |
| Previous Monthly Low | 0.8504 |
| Daily Fibonacci 38.2% | 0.8633 |
| Daily Fibonacci 61.8% | 0.8619 |
| Daily Pivot Point S1 | 0.8589 |
| Daily Pivot Point S2 | 0.8563 |
| Daily Pivot Point S3 | 0.8530 |
| Daily Pivot Point R1 | 0.8649 |
| Daily Pivot Point R2 | 0.8682 |
| Daily Pivot Point R3 | 0.8708 |
[/s2If]
Download Nehcap EAWe have two EAs that are operational on our LIVE accounts.
- EA-FIX: Check out the details here. Download EA-FIX . EA-FIX is a non-grid HFT scalper.
- EA-GROWTH: High quality low dd EA using trend grids. Download EA_GROWTHJoin Our Telegram Group


