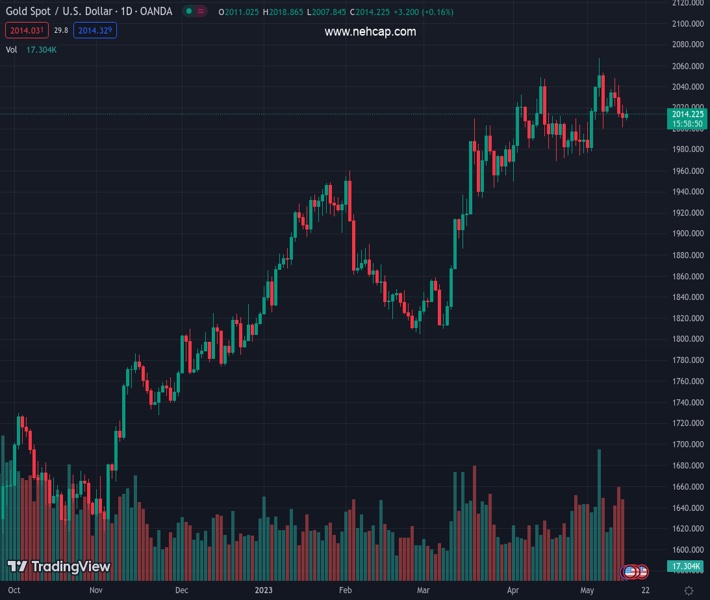
#XAUUSD @ 2,014.14 Gold price is expected to return back to $2,000.00 as the USD Index is holding its support. (Pivot Orderbook analysis)
…
This is a premium post.
[s2If !current_user_can(access_s2member_level4)]Please register for FREE REGISTER to read full post below containing analysis. In case of any error or you think you are not able to read the full post below, please email us at support#nehcap.com [lwa][/s2If] [s2If current_user_can(access_s2member_level1)]
- Gold price is expected to return back to $2,000.00 as the USD Index is holding its support.
- S&P500 futures have recovered their entire losses and have turned positive, portraying solid appeal for US equities.
- Tuesday’s Retail sales data is seen expanding by 0.7% vs. a contraction of 0.6%.
The pair currently trades last at 2014.14.
The previous day high was 2022.59 while the previous day low was 2000.95. The daily 38.2% Fib levels comes at 2009.22, expected to provide support. Similarly, the daily 61.8% fib level is at 2014.32, expected to provide resistance.
Gold price (XAU/USD) has retreated from $2,019.00 after a less-confident recovery move in the Asian session. The precious metal is expected to return to the psychological support of $2,000.00 as the US Dollar Index (DXY) has rebounded firmly.
It seems that the marginal correction in the USD Index has been bought by investors and the asset is aiming to recapture a five-week high at 102.75.
S&P500 futures have recovered their entire losses and have turned positive, portraying solid appeal for US equities. Investors are pouring funds into equities in hopes that the Federal Reserve (Fed) will pause its aggressive policy-tightening spree to avoid further damage to economic prosperity.
Investors will get more clarity on Fed’s action after the release of the monthly US Retail Sales data (April). Tuesday’s Retail sales data is seen expanding by 0.7% vs. a contraction of 0.6%. A recovery in retail demand would escalate fears of further interest rate hikes from the Fed.
The USD Index is holding strength amid uncertainty over the outcome of US debt ceiling negotiations. US President Joe Biden has announced further negotiations with Republican leaders for raising the US debt ceiling limit to avoid default on obligated payments.
Gold price is auctioning in a Rising Channel chart pattern on a two-hour scale. The upper portion of the aforementioned chart pattern is plotted from March 20 high at $2,009.88 while the lower portion is placed from March 22 low at $1,934.34. The downward-sloping trendline plotted from all-time highs at May 03 high at $2,079.78 is acting as a barricade for the Gold bulls.
Also, the 50-period Exponential Moving Average (EMA) at $2,019.38 has restricted the upside of the Gold bulls.
The Relative Strength Index (RSI) (14) is oscillating in the 40.00-60.00, indicating a lackluster move ahead.
Technical Levels: Supports and Resistances
XAUUSD currently trading at 2014.14 at the time of writing. Pair opened at 2010.84 and is trading with a change of 0.16 % .
| Overview | Overview.1 | |
|---|---|---|
| 0 | Today last price | 2014.14 |
| 1 | Today Daily Change | 3.30 |
| 2 | Today Daily Change % | 0.16 |
| 3 | Today daily open | 2010.84 |
The pair remains strongly bullish on the daily timeframe. It trades above its 20 SMA @ 2007.66, 50 SMA 1972.43, 100 SMA @ 1919.95 and 200 SMA @ 1820.95.
| Trends | Trends.1 | |
|---|---|---|
| 0 | Daily SMA20 | 2007.66 |
| 1 | Daily SMA50 | 1972.43 |
| 2 | Daily SMA100 | 1919.95 |
| 3 | Daily SMA200 | 1820.95 |
The previous day high was 2022.59 while the previous day low was 2000.95. The daily 38.2% Fib levels comes at 2009.22, expected to provide support. Similarly, the daily 61.8% fib level is at 2014.32, expected to provide resistance.
Note the levels of interest below:
- Pivot support is noted at 2000.33, 1989.82, 1978.69
- Pivot resistance is noted at 2021.97, 2033.1, 2043.61
| Levels | Levels.1 |
|---|---|
| Previous Daily High | 2022.59 |
| Previous Daily Low | 2000.95 |
| Previous Weekly High | 2048.27 |
| Previous Weekly Low | 2000.95 |
| Previous Monthly High | 2048.75 |
| Previous Monthly Low | 1949.83 |
| Daily Fibonacci 38.2% | 2009.22 |
| Daily Fibonacci 61.8% | 2014.32 |
| Daily Pivot Point S1 | 2000.33 |
| Daily Pivot Point S2 | 1989.82 |
| Daily Pivot Point S3 | 1978.69 |
| Daily Pivot Point R1 | 2021.97 |
| Daily Pivot Point R2 | 2033.10 |
| Daily Pivot Point R3 | 2043.61 |
[/s2If]
Nehcap Expert Advisor
The NEHCAP MT4 EA is high quality professional trading system geared to generate returns without using GRID or martingales. Each trade has strict risk per trade parameter. The pairs under management include EURUSD, GBPUSD, AUDCAD, AUDNZD,GBPAUD, EURAUD, EURCAD, CHFJPY and many more.
The system is trading live: LIVE ACCOUNT TRACKING
You can run it free. Apply for a free trial and track our account. Buy the system or use profit share mechanism to generate returns on your MT4.
Join Our Telegram Group


