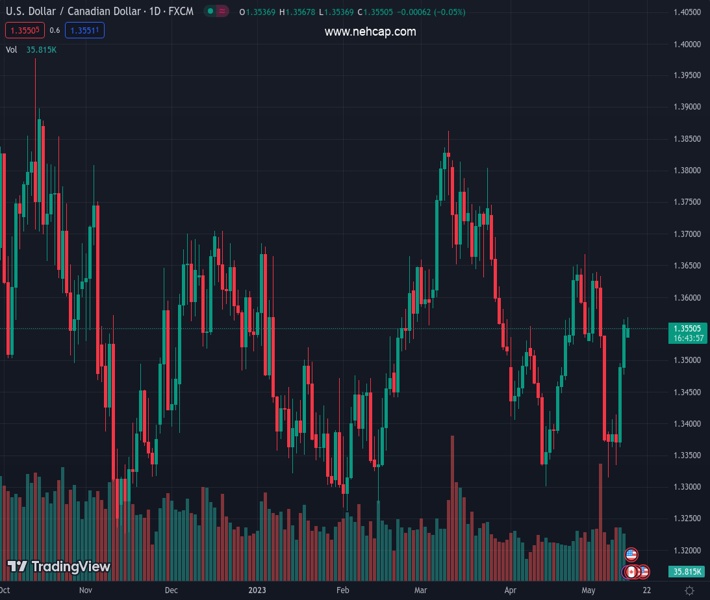
#USDCAD @ 1.35509 is struggling for decisive action as investors are awaiting Canada’s inflation for further guidance. (Pivot Orderbook analysis)
…
This is a premium post.
[s2If !current_user_can(access_s2member_level4)]Please register for FREE REGISTER to read full post below containing analysis. In case of any error or you think you are not able to read the full post below, please email us at support#nehcap.com [lwa][/s2If] [s2If current_user_can(access_s2member_level1)]
- USD/CAD is struggling for decisive action as investors are awaiting Canada’s inflation for further guidance.
- Canada’s core and headline inflation are seen softening to 3.9% and 3.7% respectively.
- USD/CAD is marching towards the downward-sloping trendline plotted from 1.3862.
The pair currently trades last at 1.35509.
The previous day high was 1.3565 while the previous day low was 1.348. The daily 38.2% Fib levels comes at 1.3533, expected to provide support. Similarly, the daily 61.8% fib level is at 1.3512, expected to provide support.
The USD/CAD pair has turned sideways around 1.3553 after a solid opening in the Asian session. The Loonie asset is expected to remain lackluster as investors are awaiting the release of Canada’s Consumer Price Index (CP) and negotiations over US debt-ceiling talks for further guidance.
The US Dollar Index (DXY) has demonstrated a loss in the upside momentum after printing a fresh five-week high of 102.75, which has infused some strength in the risk-sensitive assets, portraying an improvement in market sentiment.
On the economic data front, Canada’s core CPI is seen softening to 3.9% from the former release of 4.3%. Headline CPI is seen declining to 3.7% vs. the prior release of 4.3%. A release of the anticipated Canada inflation report will allow the Bank of Canada (BoC) to continue to its current monetary policy.
USD/CAD is marching towards the downward-sloping trendline plotted from March 10 high at 1.3862 on a four-hour scale. On a broader note, the Loonie asset is forming an Ascending Triangle chart pattern, which demonstrates a contraction in volatility.
Advancing 20-period Exponential Moving Average (EMA) at 1.3486 is continuously providing support to the US Dollar bulls.
The Relative Strength Index (RSI) (14) has shifted into the bullish range of 60.00-80.00, which advocates the continuation of the upside momentum.
The upside bias will get strengthened if the Loonie asset manages to surpass the round-level resistance of 1.3600. This will expose the asset to May 21 low at 1.3644 followed by the round-level resistance at 1.3700.
On the flip side, a break below May 12 low at 1.3480 will fade the upside bias and will drag the asset toward April 04 low at 1.3406 and May 08 low at 1.3315.
Technical Levels: Supports and Resistances
USDCAD currently trading at 1.3553 at the time of writing. Pair opened at 1.3552 and is trading with a change of 0.01 % .
| Overview | Overview.1 | |
|---|---|---|
| 0 | Today last price | 1.3553 |
| 1 | Today Daily Change | 0.0001 |
| 2 | Today Daily Change % | 0.0100 |
| 3 | Today daily open | 1.3552 |
The pair is trading above its 20 Daily moving average @ 1.3504, below its 50 Daily moving average @ 1.3569 , above its 100 Daily moving average @ 1.3514 and above its 200 Daily moving average @ 1.346
| Trends | Trends.1 | |
|---|---|---|
| 0 | Daily SMA20 | 1.3504 |
| 1 | Daily SMA50 | 1.3569 |
| 2 | Daily SMA100 | 1.3514 |
| 3 | Daily SMA200 | 1.3460 |
The previous day high was 1.3565 while the previous day low was 1.348. The daily 38.2% Fib levels comes at 1.3533, expected to provide support. Similarly, the daily 61.8% fib level is at 1.3512, expected to provide support.
Note the levels of interest below:
- Pivot support is noted at 1.3499, 1.3447, 1.3414
- Pivot resistance is noted at 1.3585, 1.3618, 1.367
| Levels | Levels.1 |
|---|---|
| Previous Daily High | 1.3565 |
| Previous Daily Low | 1.3480 |
| Previous Weekly High | 1.3565 |
| Previous Weekly Low | 1.3315 |
| Previous Monthly High | 1.3668 |
| Previous Monthly Low | 1.3301 |
| Daily Fibonacci 38.2% | 1.3533 |
| Daily Fibonacci 61.8% | 1.3512 |
| Daily Pivot Point S1 | 1.3499 |
| Daily Pivot Point S2 | 1.3447 |
| Daily Pivot Point S3 | 1.3414 |
| Daily Pivot Point R1 | 1.3585 |
| Daily Pivot Point R2 | 1.3618 |
| Daily Pivot Point R3 | 1.3670 |
[/s2If]
Nehcap Expert Advisor
The NEHCAP MT4 EA is high quality professional trading system geared to generate returns without using GRID or martingales. Each trade has strict risk per trade parameter. The pairs under management include EURUSD, GBPUSD, AUDCAD, AUDNZD,GBPAUD, EURAUD, EURCAD, CHFJPY and many more.
The system is trading live: LIVE ACCOUNT TRACKING
You can run it free. Apply for a free trial and track our account. Buy the system or use profit share mechanism to generate returns on your MT4.
Join Our Telegram Group


