#EURUSD @ 1.08847 US Data: March ISM Manufacturing PMI and February Construction Spending below expectations. (Pivot Orderbook analysis)
…
This is a premium post.
[s2If !current_user_can(access_s2member_level4)]Please register for PREMIUM VERSION HERE to read full post below containing analysis. In case of any error or you think you are not able to read the full post below, please email us at support#nehcap.com [lwa][/s2If] [s2If current_user_can(access_s2member_level4)]
- US Data: March ISM Manufacturing PMI and February Construction Spending below expectations.
- US Dollar Index tumbles as US yields sank.
- EUR/USD looking to test March highs at 1.0925/30.
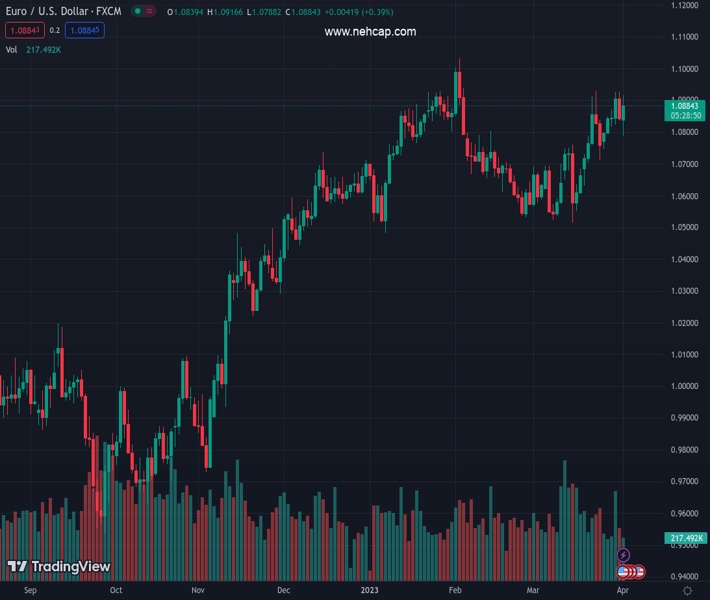
The pair currently trades last at 1.08847.
The previous day high was 1.0926 while the previous day low was 1.0837. The daily 38.2% Fib levels comes at 1.0871, expected to provide support. Similarly, the daily 61.8% fib level is at 1.0892, expected to provide resistance.
The EUR/USD rose further following the release of US Economic data and printed a fresh daily high at 1.0916. It then pulled back to 1.0885. The US Dollar is under pressure amid lower yields and risk appetite.
The US Dollar Index is falling 0.50% and is about to test last week’s lows near 102.00. The US 10-year dropped to 3.41%, the lowest level in a week. The lower gained momentum after the release of the US ISM Manufacturing report.
Data showed that economic activity in the US manufacturing sector continued to contract with the ISM Manufacturing PMI falling to 46.3 from 47.7 in February, below the market consensus of 47.5. Ahead of the ADP and the NFP, the Employment index fell to 46.9 from 49.1. A different report showed Construction Spending declined by 0.1% in February.
European Central Bank Robert Holzmann said a half-point hike is still on the cards for May. According to him, it the central bank slows down rate hikes to 25 bps it would be hard to go back.
The EUR/USD approached the 1.0925/30 key resistance area. That zone capped the upside during the last two weeks. A break higher would strengthen the outlook for the Euro. A failure could clear the way for a bearish correction. Support levels might be located at 1.0855 and 1.0815.
Technical Levels: Supports and Resistances
EURUSD currently trading at 1.0885 at the time of writing. Pair opened at 1.084 and is trading with a change of 0.42 % .
| Overview | Overview.1 | |
|---|---|---|
| 0 | Today last price | 1.0885 |
| 1 | Today Daily Change | 0.0045 |
| 2 | Today Daily Change % | 0.4200 |
| 3 | Today daily open | 1.0840 |
The pair remains strongly bullish on the daily timeframe. It trades above its 20 SMA @ 1.0724, 50 SMA 1.0732, 100 SMA @ 1.0651 and 200 SMA @ 1.0342.
| Trends | Trends.1 | |
|---|---|---|
| 0 | Daily SMA20 | 1.0724 |
| 1 | Daily SMA50 | 1.0732 |
| 2 | Daily SMA100 | 1.0651 |
| 3 | Daily SMA200 | 1.0342 |
The previous day high was 1.0926 while the previous day low was 1.0837. The daily 38.2% Fib levels comes at 1.0871, expected to provide support. Similarly, the daily 61.8% fib level is at 1.0892, expected to provide resistance.
Note the levels of interest below:
- Pivot support is noted at 1.0809, 1.0779, 1.072
- Pivot resistance is noted at 1.0898, 1.0956, 1.0987
| Levels | Levels.1 |
|---|---|
| Previous Daily High | 1.0926 |
| Previous Daily Low | 1.0837 |
| Previous Weekly High | 1.0926 |
| Previous Weekly Low | 1.0745 |
| Previous Monthly High | 1.0930 |
| Previous Monthly Low | 1.0516 |
| Daily Fibonacci 38.2% | 1.0871 |
| Daily Fibonacci 61.8% | 1.0892 |
| Daily Pivot Point S1 | 1.0809 |
| Daily Pivot Point S2 | 1.0779 |
| Daily Pivot Point S3 | 1.0720 |
| Daily Pivot Point R1 | 1.0898 |
| Daily Pivot Point R2 | 1.0956 |
| Daily Pivot Point R3 | 1.0987 |
[/s2If]
Join Our Telegram Group


