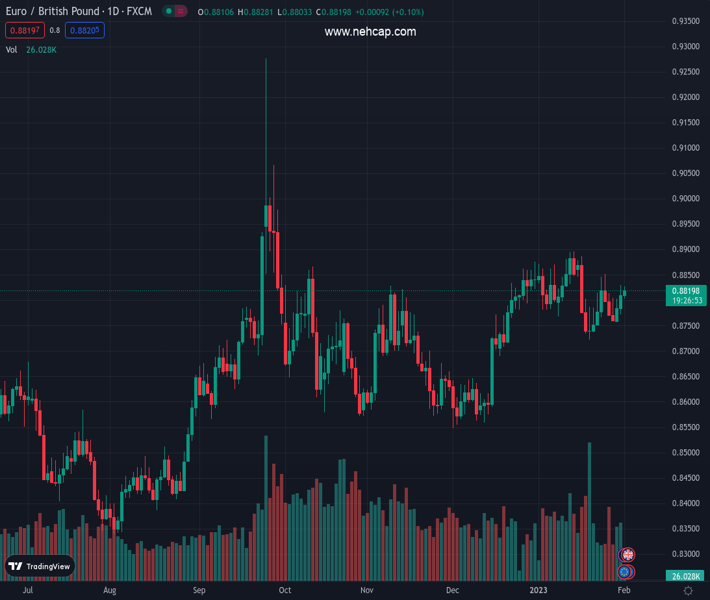
#EURGBP @ 0.88198 snaps two-day uptrend as it retreats from intraday high., @nehcap view: Limited downside expected (Pivot Orderbook analysis)
…
This is a premium post.
[s2If !current_user_can(access_s2member_level4)]Please register for PREMIUM VERSION HERE to read full post below containing analysis. In case of any error or you think you are not able to read the full post below, please email us at support#nehcap.com [lwa][/s2If] [s2If current_user_can(access_s2member_level4)]
- EUR/GBP snaps two-day uptrend as it retreats from intraday high.
- Short-term key resistance line challenges buyers amid looming bear cross on MACD, RSI pullback.
- Convergence of 100-HMA, 200-HMA appears tough nut to crack for bears.
The pair currently trades last at 0.88198.
The previous day high was 0.883 while the previous day low was 0.8772. The daily 38.2% Fib levels comes at 0.8808, expected to provide support. Similarly, the daily 61.8% fib level is at 0.8794, expected to provide support.
EUR/GBP returns to the bear’s radar, after a two-day off, as the quote mark another U-turn from the two-week-old descending resistance line during early Wednesday. That said, the cross-currency pair drops to 0.8818 by the press time.
Not only the multiple failures to cross the downward-sloping trend line from January 13 but the impending bear cross on the MACD and the RSI’s (14) retreat from the overbought territory also hint at the quote’s further weakness.
However, a convergence of the 100-Hour Moving Average (HMA) and the 200-HMA, around 0.8790 at the latest, put a floor under the EUR/GBP prices.
In a case where the EUR/GBP drops below the 0.8790 support confluence, a two-week-old ascending trend line, close to 0.8775 by the press time, could act as the last defense for the pair buyers.
On the contrary, a successful break of the aforementioned resistance line, close to 0.8825, could easily poke the previous weekly high near 0.8885.
Though, the EUR/GBP bulls need confirmation from the previous monthly high surrounding the 0.890 round figure to convince the buyers.
Overall, EUR/GBP is likely to witness further downside but the gap towards the north appears limited.
Trend: Limited downside expected
Technical Levels: Supports and Resistances
EURGBP currently trading at 0.882 at the time of writing. Pair opened at 0.8819 and is trading with a change of 0.01% % .
| Overview | Overview.1 | |
|---|---|---|
| 0 | Today last price | 0.882 |
| 1 | Today Daily Change | 0.0001 |
| 2 | Today Daily Change % | 0.01% |
| 3 | Today daily open | 0.8819 |
The pair remains strongly bullish on the daily timeframe. It trades above its 20 SMA @ 0.8806, 50 SMA 0.874, 100 SMA @ 0.8738 and 200 SMA @ 0.8626.
| Trends | Trends.1 | |
|---|---|---|
| 0 | Daily SMA20 | 0.8806 |
| 1 | Daily SMA50 | 0.8740 |
| 2 | Daily SMA100 | 0.8738 |
| 3 | Daily SMA200 | 0.8626 |
The previous day high was 0.883 while the previous day low was 0.8772. The daily 38.2% Fib levels comes at 0.8808, expected to provide support. Similarly, the daily 61.8% fib level is at 0.8794, expected to provide support.
Note the levels of interest below:
- Pivot support is noted at 0.8784, 0.8749, 0.8726
- Pivot resistance is noted at 0.8842, 0.8865, 0.89
| Levels | Levels.1 |
|---|---|
| Previous Daily High | 0.8830 |
| Previous Daily Low | 0.8772 |
| Previous Weekly High | 0.8852 |
| Previous Weekly Low | 0.8754 |
| Previous Monthly High | 0.8897 |
| Previous Monthly Low | 0.8722 |
| Daily Fibonacci 38.2% | 0.8808 |
| Daily Fibonacci 61.8% | 0.8794 |
| Daily Pivot Point S1 | 0.8784 |
| Daily Pivot Point S2 | 0.8749 |
| Daily Pivot Point S3 | 0.8726 |
| Daily Pivot Point R1 | 0.8842 |
| Daily Pivot Point R2 | 0.8865 |
| Daily Pivot Point R3 | 0.8900 |
[/s2If]
Join Our Telegram Group


