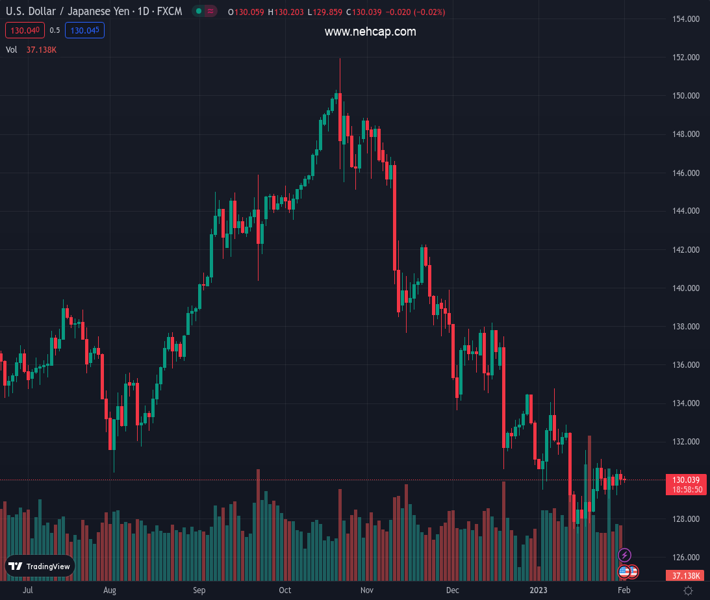
#USDJPY @ 130.018 remains depressed inside a fortnight-old triangle after reversing from one-week high., @nehcap view: Pullback expected (Pivot Orderbook analysis)
…
This is a premium post.
[s2If !current_user_can(access_s2member_level4)]Please register for PREMIUM VERSION HERE to read full post below containing analysis. In case of any error or you think you are not able to read the full post below, please email us at support#nehcap.com [lwa][/s2If] [s2If current_user_can(access_s2member_level4)]
- USD/JPY remains depressed inside a fortnight-old triangle after reversing from one-week high.
- Convergence of 100-EMA, descending trend line from mid-December guards immediate upside.
- Sluggish RSI, multiple hurdles to the north challenge buyers.
- 200-EMA acts as the last defense for bears.
The pair currently trades last at 130.018.
The previous day high was 130.53 while the previous day low was 129.74. The daily 38.2% Fib levels comes at 130.04, expected to provide resistance. Similarly, the daily 61.8% fib level is at 130.23, expected to provide resistance.
USD/JPY stays pressured around the 130.00 round figure, following a pullback from the one-week high, as the Yen pair traders remain cautious ahead of the Federal Reserve (Fed) monetary policy outcome on Wednesday.
Technically, the two-week-long symmetrical triangle restricts the immediate USD/JPY moves.
That said, the pair’s latest weakness could be linked to the failure to cross the downward-sloping resistance line from December 15 and the 100-bar Exponential Moving Average (EMA), around 130.30 by the press time. Also challenging the USD/JPY buyers could be the sluggish RSI (14) line.
It’s worth noting, however, that the pair sellers need to conquer the stated triangle’s support line, around 129.50 at the latest, to retake control. Following that, a slump toward the previous monthly low of 127.21 can’t be ruled out.
Alternatively, the 130.30 resistance confluence restricts immediate USD/JPY upside ahead of the aforementioned triangle’s top line, close to 130.55 as we write.
Should the Yen pair remains firmer past 130.55, the 200-EMA level surrounding 131.75 will act as the last defense of the bears, a break of which may open doors for the quote’s run-up towards the previous monthly high near 134.80.
Trend: Pullback expected
Technical Levels: Supports and Resistances
USDJPY currently trading at 130.07 at the time of writing. Pair opened at 130.14 and is trading with a change of -0.05% % .
| Overview | Overview.1 | |
|---|---|---|
| 0 | Today last price | 130.07 |
| 1 | Today Daily Change | -0.07 |
| 2 | Today Daily Change % | -0.05% |
| 3 | Today daily open | 130.14 |
The pair remains strongly bearish on the daily time frame. It trades below the 20 SMA @ 130.33, 50 SMA 133.38, 100 SMA @ 139.19 and 200 SMA @ 136.79.
| Trends | Trends.1 | |
|---|---|---|
| 0 | Daily SMA20 | 130.33 |
| 1 | Daily SMA50 | 133.38 |
| 2 | Daily SMA100 | 139.19 |
| 3 | Daily SMA200 | 136.79 |
The previous day high was 130.53 while the previous day low was 129.74. The daily 38.2% Fib levels comes at 130.04, expected to provide resistance. Similarly, the daily 61.8% fib level is at 130.23, expected to provide resistance.
Note the levels of interest below:
- Pivot support is noted at 129.74, 129.35, 128.95
- Pivot resistance is noted at 130.53, 130.93, 131.32
| Levels | Levels.1 |
|---|---|
| Previous Daily High | 130.53 |
| Previous Daily Low | 129.74 |
| Previous Weekly High | 131.12 |
| Previous Weekly Low | 129.02 |
| Previous Monthly High | 134.78 |
| Previous Monthly Low | 127.22 |
| Daily Fibonacci 38.2% | 130.04 |
| Daily Fibonacci 61.8% | 130.23 |
| Daily Pivot Point S1 | 129.74 |
| Daily Pivot Point S2 | 129.35 |
| Daily Pivot Point S3 | 128.95 |
| Daily Pivot Point R1 | 130.53 |
| Daily Pivot Point R2 | 130.93 |
| Daily Pivot Point R3 | 131.32 |
[/s2If]
Join Our Telegram Group


