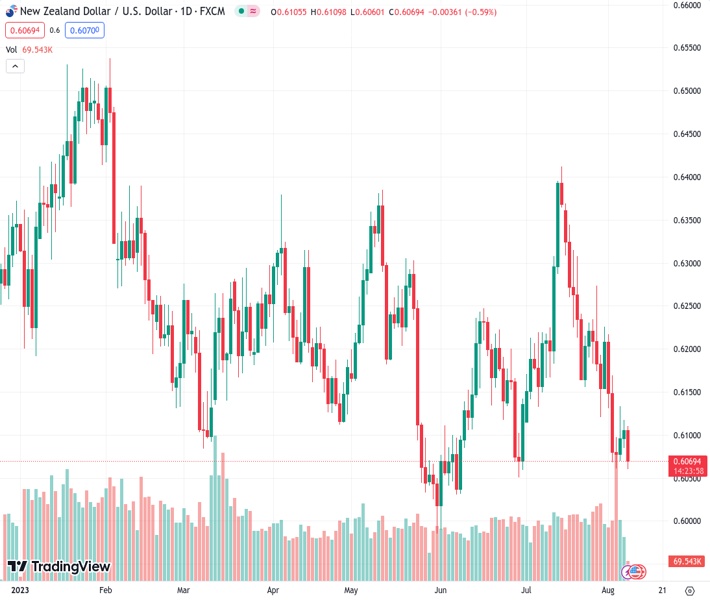
The NZDUSD pair is currently experiencing a pullback from a support level that has been in place for the past 10 months. This decline is being supported by bearish signals from the Moving Average Convergence Divergence (MACD) indicator. According to the perspective of @nehcap, it is anticipated that there will be continued downward movement in the near future.
…
This is a premium post.
[s2If !current_user_can(access_s2member_level4)]Please register for FREE REGISTER to read full post below containing analysis. In case of any error or you think you are not able to read the full post below, please email us at support#nehcap.com [lwa][/s2If] [s2If current_user_can(access_s2member_level1)]
- NZD/USD extends pullback from 10-month-old previous support amid bearish MACD signals.
The pair currently trades last at 0.60655.
The previous day high was 0.6118 while the previous day low was 0.6084. The daily 38.2% Fib levels comes at 0.6105, expected to provide resistance. Similarly, the daily 61.8% fib level is at 0.6097, expected to provide resistance.
NZD/USD stands on slippery ground as it renews its intraday low near 0.6060 heading into Tuesday’s European session, printing the biggest daily loss, so far, in a week.
In doing so, the Kiwi pair justifies late previous week’s inability of the bulls to retake control after breaking an upward-sloping support line from October on August 02.
Not only the sustained reversal from the multi-month-old support-turned-resistance but the quote’s sustained trading below the three-week-old descending resistance line and the 200-DMA, respectively near 0.6145 and 0.6230, also challenge the NZD/USD buyers.
It’s worth noting that the Kiwi pair’s recovery beyond 0.6230 appears elusive unless crossing July’s peak of around 0.6415.
On the flip side, a 50% Fibonacci retracement of October 2022 to February 2023 upside, near 0.6025, can restrict the short-term downside of the NZD/USD price.
Following that, June’s low of 0.5985 and the 61.8% Fibonacci retracement level surrounding 0.5900 will lure the Kiwi bears.
To sum up, NZD/USD remains on the bear’s radar and appears set to challenge the yearly low marked in June surrounding 0.5985 as the US Dollar extends the week-start recovery amid sour sentiment.
Also read: NZD/USD keeps the red below 0.6100 on stronger USD, reacts little to Chinese trade data
Trend: Further downside expected
Technical Levels: Supports and Resistances
NZDUSD currently trading at 0.6063 at the time of writing. Pair opened at 0.6107 and is trading with a change of -0.72% % .
| Overview | Overview.1 | |
|---|---|---|
| 0 | Today last price | 0.6063 |
| 1 | Today Daily Change | -0.0044 |
| 2 | Today Daily Change % | -0.72% |
| 3 | Today daily open | 0.6107 |
The pair remains strongly bearish on the daily time frame. It trades below the 20 SMA @ 0.621, 50 SMA 0.6166, 100 SMA @ 0.6192 and 200 SMA @ 0.6229.
| Trends | Trends.1 | |
|---|---|---|
| 0 | Daily SMA20 | 0.6210 |
| 1 | Daily SMA50 | 0.6166 |
| 2 | Daily SMA100 | 0.6192 |
| 3 | Daily SMA200 | 0.6229 |
The previous day high was 0.6118 while the previous day low was 0.6084. The daily 38.2% Fib levels comes at 0.6105, expected to provide resistance. Similarly, the daily 61.8% fib level is at 0.6097, expected to provide resistance.
Note the levels of interest below:
- Pivot support is noted at 0.6088, 0.6069, 0.6054
- Pivot resistance is noted at 0.6122, 0.6137, 0.6156
| Levels | Levels.1 |
|---|---|
| Previous Daily High | 0.6118 |
| Previous Daily Low | 0.6084 |
| Previous Weekly High | 0.6226 |
| Previous Weekly Low | 0.6060 |
| Previous Monthly High | 0.6413 |
| Previous Monthly Low | 0.6120 |
| Daily Fibonacci 38.2% | 0.6105 |
| Daily Fibonacci 61.8% | 0.6097 |
| Daily Pivot Point S1 | 0.6088 |
| Daily Pivot Point S2 | 0.6069 |
| Daily Pivot Point S3 | 0.6054 |
| Daily Pivot Point R1 | 0.6122 |
| Daily Pivot Point R2 | 0.6137 |
| Daily Pivot Point R3 | 0.6156 |
[/s2If]
Download Nehcap EAWe have two EAs that are operational on our LIVE accounts.
- EA-FIX: Check out the details here. Download EA-FIX . EA-FIX is a non-grid HFT scalper.
- EA-GROWTH: High quality low dd EA using trend grids. Download EA_GROWTHJoin Our Telegram Group


