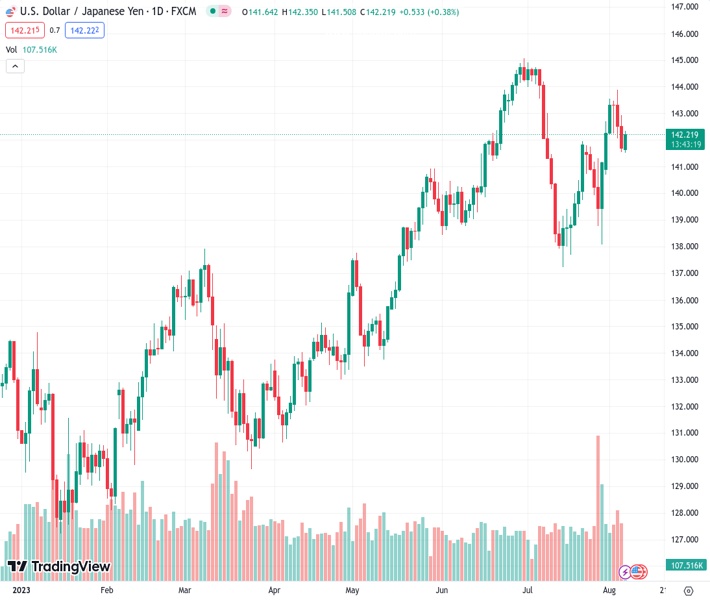
The USDJPY currency pair is currently trading at 142.245 and it remains higher than both the 50-hour and 100-hour Exponential Moving Averages (EMAs), showing a positive incline in its movement.
…
This is a premium post.
[s2If !current_user_can(access_s2member_level4)]Please register for FREE REGISTER to read full post below containing analysis. In case of any error or you think you are not able to read the full post below, please email us at support#nehcap.com [lwa][/s2If] [s2If current_user_can(access_s2member_level1)]
- USD/JPY stands above the 50- and 100-hour EMAs with an upward slope.
The pair currently trades last at 142.245.
The previous day high was 142.93 while the previous day low was 141.55. The daily 38.2% Fib levels comes at 142.08, expected to provide support. Similarly, the daily 61.8% fib level is at 142.4, expected to provide resistance.
The USD/JPY pair reverses Friday’s pullback and holds ground around 142.22 heading into the early European session on Monday. According to a summary of the opinions of the Bank of Japan (BoJ) released on Monday, one board member said that wages and prices could keep rising at a pace not seen in the past. BoJ policymakers added that it’s necessary to maintain ultra-low interest rates until robust domestic demand and higher wages replace cost-push factors as the primary drivers of price increases and maintain sustainable inflation around its target.
According to the four-hour chart, the USD/JPY pair stands above the 50- and 100-hour Exponential Moving Averages (EMAs) with an upward slope, which means the path of least resistance is to the upside for the time being.
USD/JPY’s immediate resistance emerges at 142.60 (the midline of the Bollinger Band). Further north, the 142.90–143.00 area appears to be a tough nut to crack for USD/JPY. The mentioned level represents the confluence of a psychological round mark and a high of August 4. Any meaningful follow-through buying could pave the way to the next hurdle at 143.60 (the upper boundary of the Bollinger Band) and 143.90 (High of August 3).
On the downside, the key contention for USD/JPY is located at 142.00 (a psychological round mark and 50-hour EMA). The next stop for the pair is seen at 141.55 (100-hour EMA and the lower limit of the Bollinger Band), followed by 141.30 (High of July 27) and 141.00 (a psychological round figure).
It’s worth noting that the Relative Strength Index (RSI) stands below 50 and the MACD holds in bearish territory, which indicates that the downside momentum has been activated.
Technical Levels: Supports and Resistances
USDJPY currently trading at 142.23 at the time of writing. Pair opened at 141.76 and is trading with a change of 0.33 % .
| Overview | Overview.1 | |
|---|---|---|
| 0 | Today last price | 142.23 |
| 1 | Today Daily Change | 0.47 |
| 2 | Today Daily Change % | 0.33 |
| 3 | Today daily open | 141.76 |
The pair remains strongly bullish on the daily timeframe. It trades above its 20 SMA @ 140.63, 50 SMA 141.28, 100 SMA @ 137.88 and 200 SMA @ 136.58.
| Trends | Trends.1 | |
|---|---|---|
| 0 | Daily SMA20 | 140.63 |
| 1 | Daily SMA50 | 141.28 |
| 2 | Daily SMA100 | 137.88 |
| 3 | Daily SMA200 | 136.58 |
The previous day high was 142.93 while the previous day low was 141.55. The daily 38.2% Fib levels comes at 142.08, expected to provide support. Similarly, the daily 61.8% fib level is at 142.4, expected to provide resistance.
Note the levels of interest below:
- Pivot support is noted at 141.23, 140.7, 139.86
- Pivot resistance is noted at 142.6, 143.45, 143.98
| Levels | Levels.1 |
|---|---|
| Previous Daily High | 142.93 |
| Previous Daily Low | 141.55 |
| Previous Weekly High | 143.89 |
| Previous Weekly Low | 140.69 |
| Previous Monthly High | 144.91 |
| Previous Monthly Low | 137.24 |
| Daily Fibonacci 38.2% | 142.08 |
| Daily Fibonacci 61.8% | 142.40 |
| Daily Pivot Point S1 | 141.23 |
| Daily Pivot Point S2 | 140.70 |
| Daily Pivot Point S3 | 139.86 |
| Daily Pivot Point R1 | 142.60 |
| Daily Pivot Point R2 | 143.45 |
| Daily Pivot Point R3 | 143.98 |
[/s2If]
Download Nehcap EAWe have two EAs that are operational on our LIVE accounts.
- EA-FIX: Check out the details here. Download EA-FIX . EA-FIX is a non-grid HFT scalper.
- EA-GROWTH: High quality low dd EA using trend grids. Download EA_GROWTHJoin Our Telegram Group


