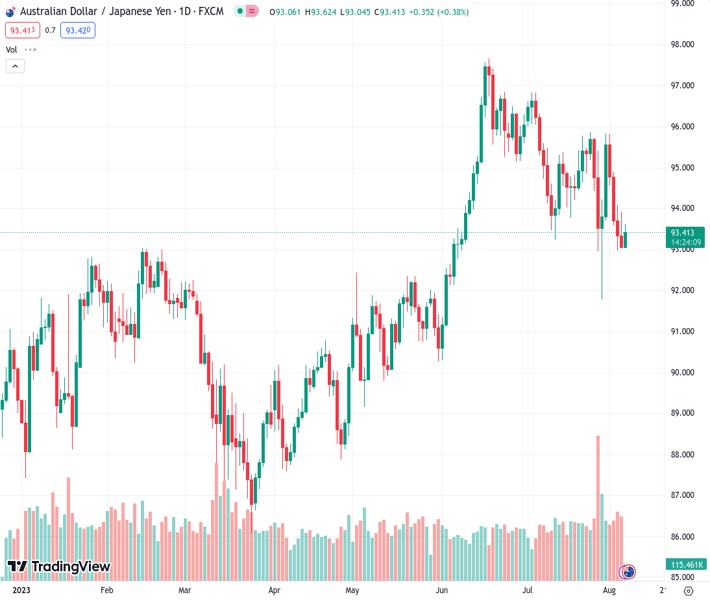
The AUDJPY pair is maintaining a defensive stance near the 93.50 level, experiencing a 0.37% increase throughout the day.
…
This is a premium post.
[s2If !current_user_can(access_s2member_level4)]Please register for FREE REGISTER to read full post below containing analysis. In case of any error or you think you are not able to read the full post below, please email us at support#nehcap.com [lwa][/s2If] [s2If current_user_can(access_s2member_level1)]
- AUD/JPY stays defensive around 93.50, gaining 0.37% for the day.
The pair currently trades last at 93.3960.
The previous day high was 93.93 while the previous day low was 93.06. The daily 38.2% Fib levels comes at 93.39, expected to provide support. Similarly, the daily 61.8% fib level is at 93.6, expected to provide resistance.
The AUD/JPY cross struggles to gain and hovers around the 93.50 region heading into the early European trading hours on Monday. That said, the optimistic development from China boosts the Australian Dollar against its rivals. The Chinese Ministry of Commerce announced on Friday that China will lift its anti-dumping and anti-subsidy tariffs on Australian barley imports effective August 5.
Meanwhile, the BoJ’s Summary of Opinions for the July meeting stated that achieving 2% inflation in a sustained and steady manner seems to be in sight. The news adds hints of a more cautious approach to Yield Curve Control (YCC) policy and weighs on the Japanese Yen.
From a technical perspective, AUD/JPY trades within a descending trend channel line from the middle of June on the four-hour chart. That said, the path of least resistance for the AUD/JPY is to the downside as the cross holds below the 50- and 100-hour Exponential Moving Averages (EMAs).
The immediate resistance level for AUD/JPY is seen at 94.00, the 50-hour EMA, and a psychological round mark. The next barrier to watch is 94.40 (100-hour EMA), en route to 95.40 (High of July 14) and finally at 95.50 (the upper boundary of a descending trend channel).
On the flip side, the cross will meet an initial support level at 93.00 (a psychological round figure, Low of August 4). The next downside stop appears at 92.60 (the swing low of July 28), followed by 92.35 (the lower limit of a descending trend channel). A break below the latter will see a drop to 92.15 (Low of June 6).
It’s worth noting that the Relative Strength Index (RSI) and Moving Average Convergence/Divergence (MACD) hold in bearish territory, supporting the sellers for now.
Technical Levels: Supports and Resistances
AUDJPY currently trading at 93.47 at the time of writing. Pair opened at 93.12 and is trading with a change of 0.38 % .
| Overview | Overview.1 | |
|---|---|---|
| 0 | Today last price | 93.47 |
| 1 | Today Daily Change | 0.35 |
| 2 | Today Daily Change % | 0.38 |
| 3 | Today daily open | 93.12 |
The pair is trading below its 20 Daily moving average @ 94.51, below its 50 Daily moving average @ 94.67 , above its 100 Daily moving average @ 92.23 and above its 200 Daily moving average @ 91.92
| Trends | Trends.1 | |
|---|---|---|
| 0 | Daily SMA20 | 94.51 |
| 1 | Daily SMA50 | 94.67 |
| 2 | Daily SMA100 | 92.23 |
| 3 | Daily SMA200 | 91.92 |
The previous day high was 93.93 while the previous day low was 93.06. The daily 38.2% Fib levels comes at 93.39, expected to provide support. Similarly, the daily 61.8% fib level is at 93.6, expected to provide resistance.
Note the levels of interest below:
- Pivot support is noted at 92.81, 92.5, 91.94
- Pivot resistance is noted at 93.68, 94.24, 94.55
| Levels | Levels.1 |
|---|---|
| Previous Daily High | 93.93 |
| Previous Daily Low | 93.06 |
| Previous Weekly High | 95.83 |
| Previous Weekly Low | 92.97 |
| Previous Monthly High | 96.84 |
| Previous Monthly Low | 91.79 |
| Daily Fibonacci 38.2% | 93.39 |
| Daily Fibonacci 61.8% | 93.60 |
| Daily Pivot Point S1 | 92.81 |
| Daily Pivot Point S2 | 92.50 |
| Daily Pivot Point S3 | 91.94 |
| Daily Pivot Point R1 | 93.68 |
| Daily Pivot Point R2 | 94.24 |
| Daily Pivot Point R3 | 94.55 |
[/s2If]
Download Nehcap EAWe have two EAs that are operational on our LIVE accounts.
- EA-FIX: Check out the details here. Download EA-FIX . EA-FIX is a non-grid HFT scalper.
- EA-GROWTH: High quality low dd EA using trend grids. Download EA_GROWTHJoin Our Telegram Group


