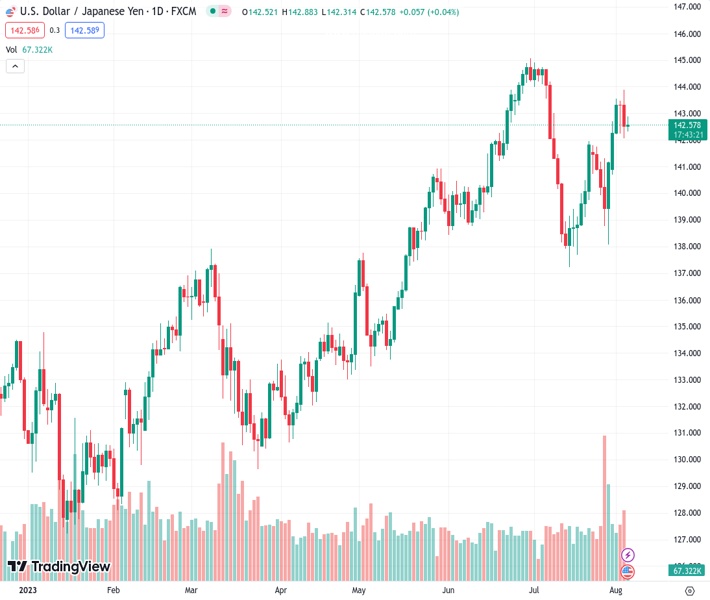
The USDJPY pair, currently at a price of 142.594, is continuing its decline from the previous day’s high. Bears are now targeting a horizontal support level that has been in place for several days. According to the view of @nehcap, it is expected that the pair will experience further downside movement.
…
This is a premium post.
[s2If !current_user_can(access_s2member_level4)]Please register for FREE REGISTER to read full post below containing analysis. In case of any error or you think you are not able to read the full post below, please email us at support#nehcap.com [lwa][/s2If] [s2If current_user_can(access_s2member_level1)]
- USD/JPY extends the previous day’s pullback from one-month high as bears attack multi-day-old horizontal support.
The pair currently trades last at 142.594.
The previous day high was 143.89 while the previous day low was 142.06. The daily 38.2% Fib levels comes at 142.76, expected to provide resistance. Similarly, the daily 61.8% fib level is at 143.19, expected to provide resistance.
USD/JPY holds lower grounds near 142.50, clings to mild losses amid early Friday morning in Europe after reversing from the highest level in a month the previous day.
The Yen pair’s latest pullback could be linked to the market’s positioning for the US employment report for June, as well as a retreat of the US Treasury bond yields from a multi-day high marked the previous day.
Furthermore, bearish MACD signals and the Yen pair’s clear observance of the descending resistance line from June 30, at 143.40 by the press time, also keep the USD/JPY bears hopeful.
However, a horizontal area comprising multiple levels marked since June 18, around 142.00, quickly followed by the 200-SMA level of 141.85, restricts the Yen pair’s further downside.
In a case where the USD/JPY pair remains bearish past 141.85, a quick fall toward the 140.00 round figure can be expected while an ascending support line from July 14, close to 139.80, might challenge the sellers afterward.
Meanwhile, USD/JPY recovery remains elusive below the five-week-old descending resistance line of near 143.40.
Following that, a 1.5-month-long horizontal resistance area of around 143.90–144.00 will act as the final defense of the USD/JPY bears before challenging the yearly top marked in June around 145.00.
Trend: Further downside expected
Technical Levels: Supports and Resistances
USDJPY currently trading at 142.48 at the time of writing. Pair opened at 142.59 and is trading with a change of -0.08% % .
| Overview | Overview.1 | |
|---|---|---|
| 0 | Today last price | 142.48 |
| 1 | Today Daily Change | -0.11 |
| 2 | Today Daily Change % | -0.08% |
| 3 | Today daily open | 142.59 |
The pair remains strongly bullish on the daily timeframe. It trades above its 20 SMA @ 140.65, 50 SMA 141.26, 100 SMA @ 137.78 and 200 SMA @ 136.61.
| Trends | Trends.1 | |
|---|---|---|
| 0 | Daily SMA20 | 140.65 |
| 1 | Daily SMA50 | 141.26 |
| 2 | Daily SMA100 | 137.78 |
| 3 | Daily SMA200 | 136.61 |
The previous day high was 143.89 while the previous day low was 142.06. The daily 38.2% Fib levels comes at 142.76, expected to provide resistance. Similarly, the daily 61.8% fib level is at 143.19, expected to provide resistance.
Note the levels of interest below:
- Pivot support is noted at 141.81, 141.02, 139.98
- Pivot resistance is noted at 143.64, 144.68, 145.46
| Levels | Levels.1 |
|---|---|
| Previous Daily High | 143.89 |
| Previous Daily Low | 142.06 |
| Previous Weekly High | 141.82 |
| Previous Weekly Low | 138.07 |
| Previous Monthly High | 144.91 |
| Previous Monthly Low | 137.24 |
| Daily Fibonacci 38.2% | 142.76 |
| Daily Fibonacci 61.8% | 143.19 |
| Daily Pivot Point S1 | 141.81 |
| Daily Pivot Point S2 | 141.02 |
| Daily Pivot Point S3 | 139.98 |
| Daily Pivot Point R1 | 143.64 |
| Daily Pivot Point R2 | 144.68 |
| Daily Pivot Point R3 | 145.46 |
[/s2If]
Download Nehcap EAWe have two EAs that are operational on our LIVE accounts.
- EA-FIX: Check out the details here. Download EA-FIX . EA-FIX is a non-grid HFT scalper.
- EA-GROWTH: High quality low dd EA using trend grids. Download EA_GROWTHJoin Our Telegram Group


