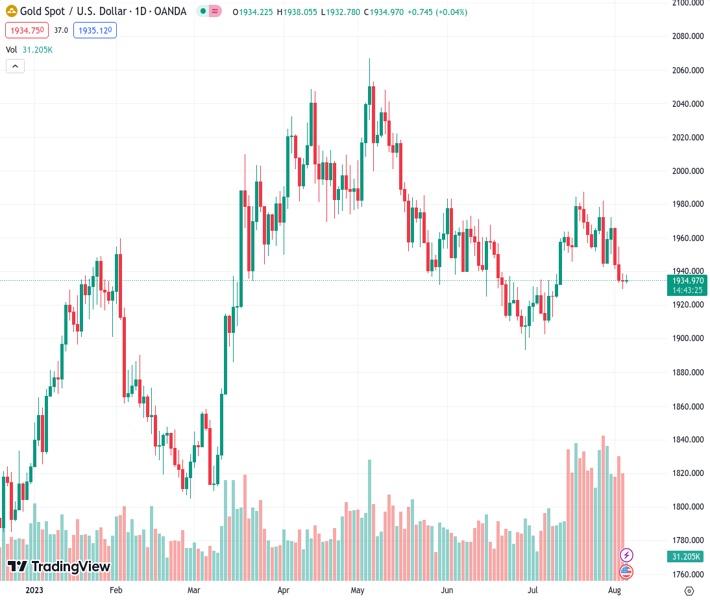
The price of gold, represented as #XAUUSD and currently at 1,934.16, continues to hover within a limited range near the $1,930 mark.
…
This is a premium post.
[s2If !current_user_can(access_s2member_level4)]Please register for FREE REGISTER to read full post below containing analysis. In case of any error or you think you are not able to read the full post below, please email us at support#nehcap.com [lwa][/s2If] [s2If current_user_can(access_s2member_level1)]
- Gold price remains confined in a narrow range around the $1,930 level.
The pair currently trades last at 1934.16.
The previous day high was 1939.0 while the previous day low was 1929.57. The daily 38.2% Fib levels comes at 1933.17, expected to provide support. Similarly, the daily 61.8% fib level is at 1935.4, expected to provide resistance.
The gold price oscillates around $1,935 heading into the early European session on Friday. Market participants await the US Nonfarm Payrolls figure due later in the American session.
The top-tier data from the US on Thursday showed that the Initial Jobless Claims increased to 227,000 for the week ended July 29, matching market consensus. Meanwhile, the ISM Service PMI for July dropped to 52.7 from 53.9 prior and was worse than expected at 53. Unit Labor Costs from Q2 increased to 1.6%, lower than the 2.6% expected.
Gold traders will take cues from the US wage inflation and employment release on Friday. The stronger-than-expected report could convince the Federal Reserve (Fed) to hike additional rates for the entire year. This, in turn, benefits the Greenback and acts as a headwind for XAU/USD. It’s worth noting that gold is sensitive to rising interest rates as they raise the opportunity cost of holding non-yielding bullion.
Furthermore, the US House committee said on Thursday that President Joe Biden needs to limit outbound US investment in China, particularly in key industries that might undermine national security. Biden may impose further outbound investment restrictions on China in the coming weeks, Reuters sources said. The escalating tensions between the US-China might exert some pressure on the US Dollar and benefit gold, a traditional safe-haven asset.
Looking ahead, all eyes are on the US Nonfarm Payrolls data due later in the day. The US economy is expected to have created 180,000 jobs in July. Also, the Unemployment Rate and Average Hourly Earnings will be released on Friday. The Unemployment Rate is expected to remain at 3.6%, and Average Hourly Earnings YoY are expected to increase by 4.2%. Market participants find trading opportunities around the gold price.
Technical Levels: Supports and Resistances
XAUUSD currently trading at 1936.36 at the time of writing. Pair opened at 1934.06 and is trading with a change of 0.12 % .
| Overview | Overview.1 | |
|---|---|---|
| 0 | Today last price | 1936.36 |
| 1 | Today Daily Change | 2.30 |
| 2 | Today Daily Change % | 0.12 |
| 3 | Today daily open | 1934.06 |
The pair is trading below its 20 Daily moving average @ 1953.65, below its 50 Daily moving average @ 1945.24 , below its 100 Daily moving average @ 1968.86 and above its 200 Daily moving average @ 1893.5
| Trends | Trends.1 | |
|---|---|---|
| 0 | Daily SMA20 | 1953.65 |
| 1 | Daily SMA50 | 1945.24 |
| 2 | Daily SMA100 | 1968.86 |
| 3 | Daily SMA200 | 1893.50 |
The previous day high was 1939.0 while the previous day low was 1929.57. The daily 38.2% Fib levels comes at 1933.17, expected to provide support. Similarly, the daily 61.8% fib level is at 1935.4, expected to provide resistance.
Note the levels of interest below:
- Pivot support is noted at 1929.42, 1924.78, 1919.99
- Pivot resistance is noted at 1938.85, 1943.64, 1948.28
| Levels | Levels.1 |
|---|---|
| Previous Daily High | 1939.00 |
| Previous Daily Low | 1929.57 |
| Previous Weekly High | 1982.20 |
| Previous Weekly Low | 1942.65 |
| Previous Monthly High | 1987.54 |
| Previous Monthly Low | 1902.77 |
| Daily Fibonacci 38.2% | 1933.17 |
| Daily Fibonacci 61.8% | 1935.40 |
| Daily Pivot Point S1 | 1929.42 |
| Daily Pivot Point S2 | 1924.78 |
| Daily Pivot Point S3 | 1919.99 |
| Daily Pivot Point R1 | 1938.85 |
| Daily Pivot Point R2 | 1943.64 |
| Daily Pivot Point R3 | 1948.28 |
[/s2If]
Download Nehcap EAWe have two EAs that are operational on our LIVE accounts.
- EA-FIX: Check out the details here. Download EA-FIX . EA-FIX is a non-grid HFT scalper.
- EA-GROWTH: High quality low dd EA using trend grids. Download EA_GROWTHJoin Our Telegram Group


