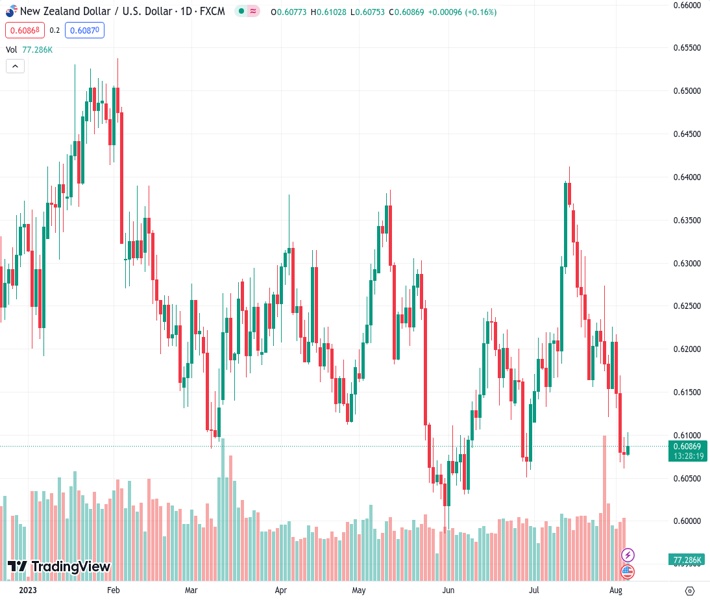
The NZDUSD pair, currently trading at 0.60882, has pulled back from its highest point of the day. This reversal comes after a rebound from a five-week low that occurred the previous day. According to our analyst @nehcap, there is only a limited expectation for a recovery in the near future.
…
This is a premium post.
[s2If !current_user_can(access_s2member_level4)]Please register for FREE REGISTER to read full post below containing analysis. In case of any error or you think you are not able to read the full post below, please email us at support#nehcap.com [lwa][/s2If] [s2If current_user_can(access_s2member_level1)]
- NZD/USD retreats from intraday high, reversing previous day’s rebound from five-week low.
The pair currently trades last at 0.60882.
The previous day high was 0.6098 while the previous day low was 0.606. The daily 38.2% Fib levels comes at 0.6075, expected to provide support. Similarly, the daily 61.8% fib level is at 0.6083, expected to provide support.
NZD/USD trims intraday gains around 0.6085 amid the initial European session on Friday as markets brace for the US employment report for July.
Also read: NZD/USD clings to modest recovery gains, struggles to capitalize on move beyond 0.6100
That said, the Kiwi pair recovered from the lowest level since June 29 the previous day but lacked follow-through, which in turn portrayed a Doji candlestick on the Daily timeframe, suggesting a reversal in the bearish trend established since mid-July.
Adding strength to the hopes of recovery is the RSI (14) line as it suggests bottom-picking by being below 50.0. Further, the position of the Doji candlestick at the multi-day low also increases the strength of the rebound.
However, the support-turned-resistance line from May 31 joins the bearish MACD signals to challenge the NZD/USD buyers around 0.6135.
Even if the quote rises past 0.6135 previous support line, a three-week-old descending resistance line, close to 0.6180, followed by the 200-DMA hurdle of 0.6230, will challenge the Kiwi bulls.
Above all, a four-month-old horizontal area surrounding 0.6390 appears a tough nut to crack for NZD/USD buyers.
On the contrary, the June 29 swing low of around 0.6050 will precede the lows marked during late May and early June, surrounding 0.6030, to challenge the short-term downside of the NZD/USD pair.
In a case where the Kiwi pair remains bearish past 0.6030, the 0.6000 psychological magnet and the yearly low marked in May around 0.5985 will be in the spotlight.
Trend: Limited recovery expected
Technical Levels: Supports and Resistances
NZDUSD currently trading at 0.6085 at the time of writing. Pair opened at 0.6078 and is trading with a change of 0.12% % .
| Overview | Overview.1 | |
|---|---|---|
| 0 | Today last price | 0.6085 |
| 1 | Today Daily Change | 0.0007 |
| 2 | Today Daily Change % | 0.12% |
| 3 | Today daily open | 0.6078 |
The pair remains strongly bearish on the daily time frame. It trades below the 20 SMA @ 0.6221, 50 SMA 0.6164, 100 SMA @ 0.6195 and 200 SMA @ 0.6226.
| Trends | Trends.1 | |
|---|---|---|
| 0 | Daily SMA20 | 0.6221 |
| 1 | Daily SMA50 | 0.6164 |
| 2 | Daily SMA100 | 0.6195 |
| 3 | Daily SMA200 | 0.6226 |
The previous day high was 0.6098 while the previous day low was 0.606. The daily 38.2% Fib levels comes at 0.6075, expected to provide support. Similarly, the daily 61.8% fib level is at 0.6083, expected to provide support.
Note the levels of interest below:
- Pivot support is noted at 0.6059, 0.6041, 0.6021
- Pivot resistance is noted at 0.6097, 0.6117, 0.6135
| Levels | Levels.1 |
|---|---|
| Previous Daily High | 0.6098 |
| Previous Daily Low | 0.6060 |
| Previous Weekly High | 0.6274 |
| Previous Weekly Low | 0.6120 |
| Previous Monthly High | 0.6413 |
| Previous Monthly Low | 0.6120 |
| Daily Fibonacci 38.2% | 0.6075 |
| Daily Fibonacci 61.8% | 0.6083 |
| Daily Pivot Point S1 | 0.6059 |
| Daily Pivot Point S2 | 0.6041 |
| Daily Pivot Point S3 | 0.6021 |
| Daily Pivot Point R1 | 0.6097 |
| Daily Pivot Point R2 | 0.6117 |
| Daily Pivot Point R3 | 0.6135 |
[/s2If]
Download Nehcap EAWe have two EAs that are operational on our LIVE accounts.
- EA-FIX: Check out the details here. Download EA-FIX . EA-FIX is a non-grid HFT scalper.
- EA-GROWTH: High quality low dd EA using trend grids. Download EA_GROWTHJoin Our Telegram Group


