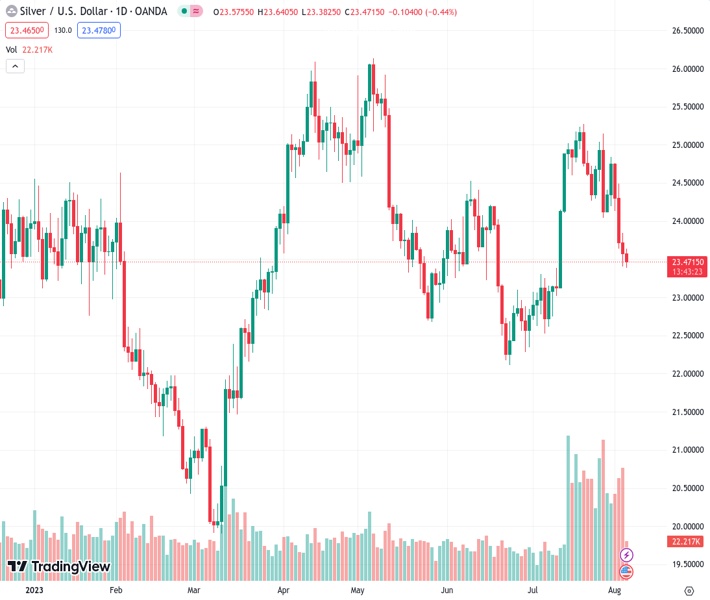
Silver has experienced consistent downward pressure over the course of four consecutive days, as indicated by #XAGUSD at 23.464.
…
This is a premium post.
[s2If !current_user_can(access_s2member_level4)]Please register for FREE REGISTER to read full post below containing analysis. In case of any error or you think you are not able to read the full post below, please email us at support#nehcap.com [lwa][/s2If] [s2If current_user_can(access_s2member_level1)]
- Silver remains under some selling pressure for the fourth straight day on Friday.
The pair currently trades last at 23.464.
The previous day high was 23.84 while the previous day low was 23.41. The daily 38.2% Fib levels comes at 23.57, expected to provide resistance. Similarly, the daily 61.8% fib level is at 23.68, expected to provide resistance.
Silver comes under some renewed selling pressure during the early European session on Friday and drops to over a three-week low in the last hour. The white metal currently trades around the $23.40 area, down for the fourth straight day, and seems vulnerable to prolonging its downward trajectory witnessed over the past two weeks or so.
The negative outlook is reinforced by the fact that technical indicators on the daily chart have been drifting lower and are still far from being in the oversold territory. Bearish traders, however, might still wait for a sustained break and acceptance below the $23.35 area, or the 61.8% Fibonacci retracement level of the June-July rally, before positioning for any further losses.
The XAG/USD might then accelerate the slide towards challenging the very important 200-day Simple Moving Average (SMA), currently pegged around the $23.00 mark. The downward trajectory could get extended and make silver vulnerable to retest the multi-month low, around the $22.15-$22.10 area touched in June, before eventually breaking below the $22.00 mark.
On the flip side, the 50% Fibo. level, around the $23.70 area, now seems to act as an immediate hurdle. Any subsequent move up is likely to attract fresh sellers and remain capped near the $24.00-$24.10 confluence support breakpoint, turned resistance. The said area comprises the 100-day SMA and the 38.2% Fibo. level, which should act as a pivotal point.
A sustained strength beyond might trigger a short-covering rally and lift the XAG/USD back towards the 23.6% Fibo. level, around $24.45-$24.50 supply zone. Some follow-through buying has the potential to lift Siver towards the $24.75 intermediate hurdle en route to the $25.00 psychological mark and the next relevant barrier near the $25.25 supply zone.
Technical levels to watch
Technical Levels: Supports and Resistances
XAGUSD currently trading at 23.42 at the time of writing. Pair opened at 23.57 and is trading with a change of -0.64 % .
| Overview | Overview.1 | |
|---|---|---|
| 0 | Today last price | 23.42 |
| 1 | Today Daily Change | -0.15 |
| 2 | Today Daily Change % | -0.64 |
| 3 | Today daily open | 23.57 |
The pair is trading below its 20 Daily moving average @ 24.32, below its 50 Daily moving average @ 23.72 , below its 100 Daily moving average @ 24.03 and above its 200 Daily moving average @ 23.15
| Trends | Trends.1 | |
|---|---|---|
| 0 | Daily SMA20 | 24.32 |
| 1 | Daily SMA50 | 23.72 |
| 2 | Daily SMA100 | 24.03 |
| 3 | Daily SMA200 | 23.15 |
The previous day high was 23.84 while the previous day low was 23.41. The daily 38.2% Fib levels comes at 23.57, expected to provide resistance. Similarly, the daily 61.8% fib level is at 23.68, expected to provide resistance.
Note the levels of interest below:
- Pivot support is noted at 23.37, 23.17, 22.94
- Pivot resistance is noted at 23.81, 24.04, 24.24
| Levels | Levels.1 |
|---|---|
| Previous Daily High | 23.84 |
| Previous Daily Low | 23.41 |
| Previous Weekly High | 25.15 |
| Previous Weekly Low | 24.04 |
| Previous Monthly High | 25.27 |
| Previous Monthly Low | 22.52 |
| Daily Fibonacci 38.2% | 23.57 |
| Daily Fibonacci 61.8% | 23.68 |
| Daily Pivot Point S1 | 23.37 |
| Daily Pivot Point S2 | 23.17 |
| Daily Pivot Point S3 | 22.94 |
| Daily Pivot Point R1 | 23.81 |
| Daily Pivot Point R2 | 24.04 |
| Daily Pivot Point R3 | 24.24 |
[/s2If]
Download Nehcap EAWe have two EAs that are operational on our LIVE accounts.
- EA-FIX: Check out the details here. Download EA-FIX . EA-FIX is a non-grid HFT scalper.
- EA-GROWTH: High quality low dd EA using trend grids. Download EA_GROWTHJoin Our Telegram Group


