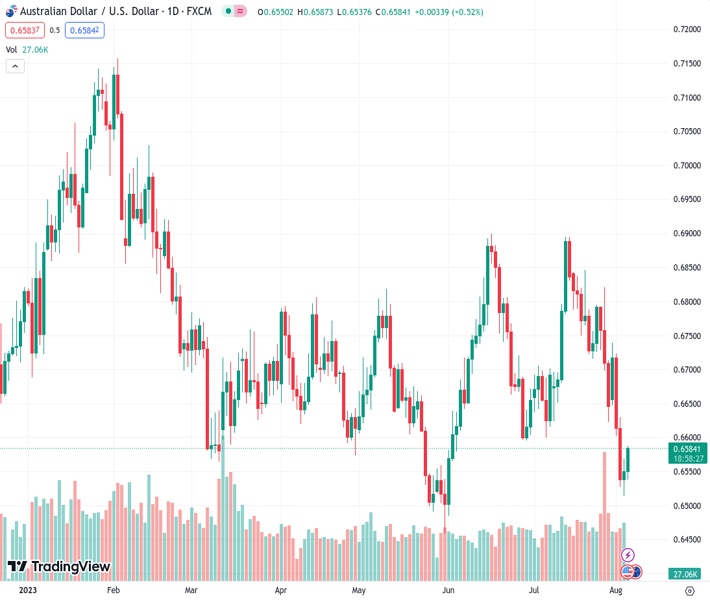
After the Reserve Bank of Australia’s quarterly Monetary Policy Statement, the AUDUSD currency pair has gained support and reached a new high for the day at 0.65825.
…
This is a premium post.
[s2If !current_user_can(access_s2member_level4)]Please register for FREE REGISTER to read full post below containing analysis. In case of any error or you think you are not able to read the full post below, please email us at support#nehcap.com [lwa][/s2If] [s2If current_user_can(access_s2member_level1)]
- AUD/USD picks up bids to refresh intraday high after RBA’s quarterly Monetary Policy Statement.
The pair currently trades last at 0.65825.
The previous day high was 0.6569 while the previous day low was 0.6514. The daily 38.2% Fib levels comes at 0.6548, expected to provide support. Similarly, the daily 61.8% fib level is at 0.6535, expected to provide support.
AUD/USD remains on the front foot as it picks up bids to refresh intraday high around 0.6580 during early Friday. In doing so, the Aussie pair cheers a pullback in the US Dollar and the Treasury bond yields, as well as the hawkish signals from the Reserve Bank of Australia’s (RBA) quarterly Monetary Policy Statement (MPS).
RBA MPS confirmed the Aussie central bank’s hawkish bias by suggesting the need for further tightening. “Trims GDP growth and inflation forecasts for end 2023, most others little changed,” said the RBA statement.
Apart from the RBA moves, expectations of witnessing a stimulus from China also favor the AUD/USD pair prices as People’s Bank of China Governor Pan Gongsheng was spotted meeting big property developers from China and assured them to provide the needed help to defend the housing sector. It’s worth noting that the PBoC Governor and China state planner are up for an unscheduled meeting on Friday.
Elsewhere, the news stating that key Republican urges Biden to set broad restrictions on US investments in China, shared by Reuters, prods the Aussie pair buyers amid a cautious mood ahead of the US employment report.
However, a retreat in the US Treasury bond yields and the US Dollar Index (DXY) allows the AUD/USD to remain firmer after bouncing off a two-month low the previous day.
Amid these plays, S&P500 Futures print mild gains and the US Treasury bond yields remain sidelined at the multi-day high, which in turn prod the US Dollar buyers. That said, the US 10-year Treasury bond yields rose to a fresh high since November 2022 before ending the trading day near 4.18% whereas the Wall Street benchmark marked mild losses by the end of Thursday’s North American session. It’s worth noting that the US bond coupons were heading towards the worrisome levels that previously triggered economic hardships, which in turn teased the US Dollar bulls due to its haven allure.
Looking forward, AUD/USD could keep the corrective bounce ahead of the US jobs report. That said, the headline Nonfarm Payrolls (NFP) bears downbeat market forecasts, likely softening to 200K versus 209K prior, which in turn may prod the US Dollar bulls in case of downbeat prints. Further, the Unemployment Rate is likely to remain static at 3.6%.
AUD/USD recovers from an upward-sloping support line from October 2022, around 0.6540 by the press time, amid nearly oversold RSI (14) line, which in turn suggests further corrective bounce off the Aussie pair towards the late June’s bottom of around 0.6600.
Technical Levels: Supports and Resistances
AUDUSD currently trading at 0.6585 at the time of writing. Pair opened at 0.655 and is trading with a change of 0.53% % .
| Overview | Overview.1 | |
|---|---|---|
| 0 | Today last price | 0.6585 |
| 1 | Today Daily Change | 0.0035 |
| 2 | Today Daily Change % | 0.53% |
| 3 | Today daily open | 0.655 |
The pair remains strongly bearish on the daily time frame. It trades below the 20 SMA @ 0.6727, 50 SMA 0.67, 100 SMA @ 0.669 and 200 SMA @ 0.6733.
| Trends | Trends.1 | |
|---|---|---|
| 0 | Daily SMA20 | 0.6727 |
| 1 | Daily SMA50 | 0.6700 |
| 2 | Daily SMA100 | 0.6690 |
| 3 | Daily SMA200 | 0.6733 |
The previous day high was 0.6569 while the previous day low was 0.6514. The daily 38.2% Fib levels comes at 0.6548, expected to provide support. Similarly, the daily 61.8% fib level is at 0.6535, expected to provide support.
Note the levels of interest below:
- Pivot support is noted at 0.652, 0.649, 0.6466
- Pivot resistance is noted at 0.6575, 0.6599, 0.6629
| Levels | Levels.1 |
|---|---|
| Previous Daily High | 0.6569 |
| Previous Daily Low | 0.6514 |
| Previous Weekly High | 0.6821 |
| Previous Weekly Low | 0.6623 |
| Previous Monthly High | 0.6895 |
| Previous Monthly Low | 0.6599 |
| Daily Fibonacci 38.2% | 0.6548 |
| Daily Fibonacci 61.8% | 0.6535 |
| Daily Pivot Point S1 | 0.6520 |
| Daily Pivot Point S2 | 0.6490 |
| Daily Pivot Point S3 | 0.6466 |
| Daily Pivot Point R1 | 0.6575 |
| Daily Pivot Point R2 | 0.6599 |
| Daily Pivot Point R3 | 0.6629 |
[/s2If]
Download Nehcap EAWe have two EAs that are operational on our LIVE accounts.
- EA-FIX: Check out the details here. Download EA-FIX . EA-FIX is a non-grid HFT scalper.
- EA-GROWTH: High quality low dd EA using trend grids. Download EA_GROWTHJoin Our Telegram Group


