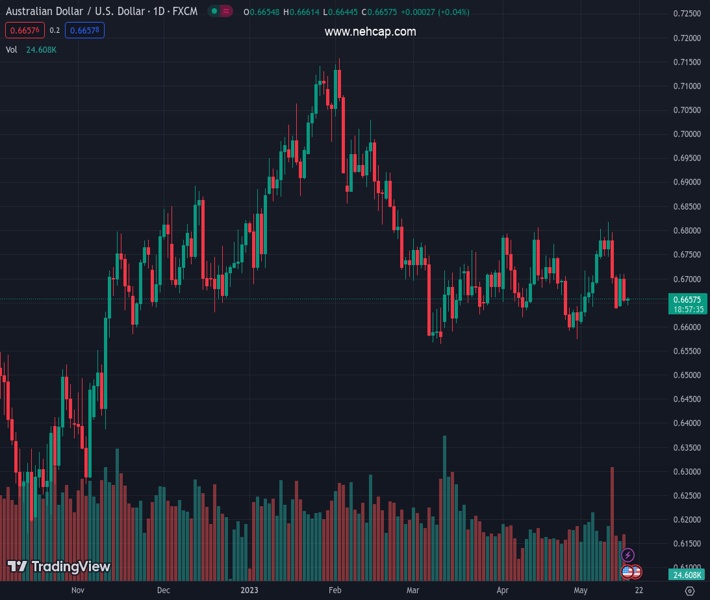
#AUDUSD @ 0.66566 has sensed selling pressure near 0.6660 amid mixed Aussie Wage Price Index data. (Pivot Orderbook analysis)
…
This is a premium post.
[s2If !current_user_can(access_s2member_level4)]Please register for FREE REGISTER to read full post below containing analysis. In case of any error or you think you are not able to read the full post below, please email us at support#nehcap.com [lwa][/s2If] [s2If current_user_can(access_s2member_level1)]
- AUD/USD has sensed selling pressure near 0.6660 amid mixed Aussie Wage Price Index data.
- Quarterly labor cost index missed estimates, however, annual data outperformed the consensus.
- The approval for raising the US borrowing cap postponed again to the end of the week.
The pair currently trades last at 0.66566.
The previous day high was 0.671 while the previous day low was 0.6651. The daily 38.2% Fib levels comes at 0.6674, expected to provide resistance. Similarly, the daily 61.8% fib level is at 0.6687, expected to provide resistance.
The AUD/USD pair has sensed selling pressure near 0.6660 as the Australian Bureau of Statistics has reported mixed Q1 Wage Price Index data. Quarterly labor cost index has remained steady at 0.8% but lower than the estimate of 0.9%. On an annual basis, the economic data has accelerated to 3.7% vs. the consensus of 3.6% and the former release of 3.3%. This might allow the Reserve Bank of Australia (RBA) to keep interest rates steady at 3.85%.
Earlier, the Aussie asset remained sideways despite the approval for raising the US borrowing cap being postponed again to the end of the week. However, one thing is clear the default is not an option now as each delegate has considered it as a disaster.
Meanwhile, the US Dollar Index (DXY) is showing signs of volatility contraction after failing in extending its recovery above 102.70.
Scrutiny of AUD/USD’s four-hour scale indicates that the upside is capped from April 14 high around 0.6806 while the downside is restricted from March 07 low around 0.6580. Intermediate support is plotted from May 03 low around 0.6640. The 200-period Exponential Moving Average (EMA) at 0.6700 is indicating a sideways trend.
Meanwhile, the Relative Strength Index (RSI) (14) has rebounded from 40.00, indicating weak downside bias.
An acceptance above the round-level resistance at 0.6800 confidently, Australian Dollar bulls will firmly drive the asset higher toward February 06 low at 0.6855 followed by February 21 high at 0.6920.
In an alternate scenario, US Dollar bulls will flex their muscles if the Aussie asset will drop below March 15 low at 0.6590. An occurrence of the same will expose the asset to March 08 low at 0.6568 followed by 02 November 2022 high around 0.6500.
Technical Levels: Supports and Resistances
AUDUSD currently trading at 0.6658 at the time of writing. Pair opened at 0.6656 and is trading with a change of 0.03 % .
| Overview | Overview.1 | |
|---|---|---|
| 0 | Today last price | 0.6658 |
| 1 | Today Daily Change | 0.0002 |
| 2 | Today Daily Change % | 0.0300 |
| 3 | Today daily open | 0.6656 |
The pair remains strongly bearish on the daily time frame. It trades below the 20 SMA @ 0.6687, 50 SMA 0.6683, 100 SMA @ 0.679 and 200 SMA @ 0.6721.
| Trends | Trends.1 | |
|---|---|---|
| 0 | Daily SMA20 | 0.6687 |
| 1 | Daily SMA50 | 0.6683 |
| 2 | Daily SMA100 | 0.6790 |
| 3 | Daily SMA200 | 0.6721 |
The previous day high was 0.671 while the previous day low was 0.6651. The daily 38.2% Fib levels comes at 0.6674, expected to provide resistance. Similarly, the daily 61.8% fib level is at 0.6687, expected to provide resistance.
Note the levels of interest below:
- Pivot support is noted at 0.6635, 0.6614, 0.6576
- Pivot resistance is noted at 0.6693, 0.6731, 0.6752
| Levels | Levels.1 |
|---|---|
| Previous Daily High | 0.6710 |
| Previous Daily Low | 0.6651 |
| Previous Weekly High | 0.6818 |
| Previous Weekly Low | 0.6636 |
| Previous Monthly High | 0.6806 |
| Previous Monthly Low | 0.6574 |
| Daily Fibonacci 38.2% | 0.6674 |
| Daily Fibonacci 61.8% | 0.6687 |
| Daily Pivot Point S1 | 0.6635 |
| Daily Pivot Point S2 | 0.6614 |
| Daily Pivot Point S3 | 0.6576 |
| Daily Pivot Point R1 | 0.6693 |
| Daily Pivot Point R2 | 0.6731 |
| Daily Pivot Point R3 | 0.6752 |
[/s2If]
Nehcap Expert Advisor
The NEHCAP MT4 EA is high quality professional trading system geared to generate returns without using GRID or martingales. Each trade has strict risk per trade parameter. The pairs under management include EURUSD, GBPUSD, AUDCAD, AUDNZD,GBPAUD, EURAUD, EURCAD, CHFJPY and many more.
The system is trading live: LIVE ACCOUNT TRACKING
You can run it free. Apply for a free trial and track our account. Buy the system or use profit share mechanism to generate returns on your MT4.
Join Our Telegram Group


