#XAGUSD @ 23.764 Silver prices slide as US retail sales data spur a jump in US Treasury bond yields, driving down to six-week lows around $23.64. (Pivot Orderbook analysis)
…
This is a premium post.
[s2If !current_user_can(access_s2member_level4)]Please register for FREE REGISTER to read full post below containing analysis. In case of any error or you think you are not able to read the full post below, please email us at support#nehcap.com [lwa][/s2If] [s2If current_user_can(access_s2member_level1)]
- Silver prices slide as US retail sales data spur a jump in US Treasury bond yields, driving XAG/USD down to six-week lows around $23.64.
- Technical outlook shows a double-top chart pattern with XAG/USD between 50 and 100-day EMAs, while a bearish RSI suggests further declines may be imminent.
- XAG/USD could target the $22.90 level if the 100-day EMA is breached, while reclaiming the $24.00 figure could pave the way for a rally toward the 50-day EMA and potentially $25.00.
The pair currently trades last at 23.764.
The previous day high was 24.21 while the previous day low was 23.88. The daily 38.2% Fib levels comes at 24.08, expected to provide resistance. Similarly, the daily 61.8% fib level is at 24.01, expected to provide resistance.
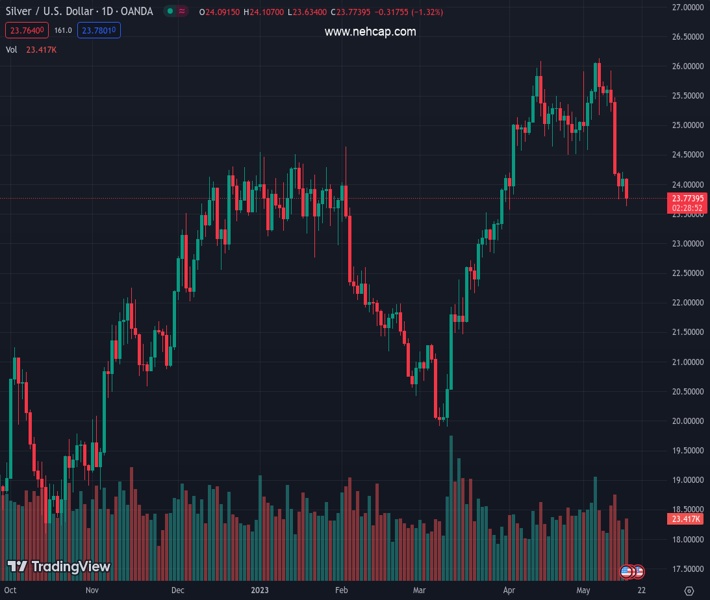
Silver price continues to validate a double-top formation, falls to fresh six-week lows around $23.64, shy of testing the 100-day Exponential Moving Average (EMA) at $23.48. Factors like US Retails Sales improving in April spurred a jump in US Treasury bond yields, a headwind for the white metal. Therefore, the XAG/USD is trading at $23.73 after reaching a daily high of $24.10.
A double-top chart pattern remains as the XAG/USD continued to slide, sitting between the 50 and 100-day EMAs, each at $24.24 and $23.48, respectively. The Relative Strength Index (RSI) indicator at bearish territory suggests Silver’s fall could continue in the near term, but the 3-day Rate of Change (RoC) has begun to show that sellers are losing momentum.
If XAG/USD cracks the 100-day EMA, that will exacerbate a fall toward the $23.00 a troy ounce figure before sellers can reach the double-top’s objective to fall toward $22.90, shy of testing the 200-day EMA at $22.77.
On the other hand, if XAG/USD reclaims the $24.00 figure, that could exert upward pressure on the XAG/USD and open the door to test the 50-day EMA. A breach of the latter will expose the February 2 high at $24.63 before challenging the $25.00 psychological figure.
Technical Levels: Supports and Resistances
XAGUSD currently trading at 23.76 at the time of writing. Pair opened at 24.09 and is trading with a change of -1.37 % .
| Overview | Overview.1 | |
|---|---|---|
| 0 | Today last price | 23.76 |
| 1 | Today Daily Change | -0.33 |
| 2 | Today Daily Change % | -1.37 |
| 3 | Today daily open | 24.09 |
The pair is trading below its 20 Daily moving average @ 25.12, below its 50 Daily moving average @ 23.93 , above its 100 Daily moving average @ 23.39 and above its 200 Daily moving average @ 21.87
| Trends | Trends.1 | |
|---|---|---|
| 0 | Daily SMA20 | 25.12 |
| 1 | Daily SMA50 | 23.93 |
| 2 | Daily SMA100 | 23.39 |
| 3 | Daily SMA200 | 21.87 |
The previous day high was 24.21 while the previous day low was 23.88. The daily 38.2% Fib levels comes at 24.08, expected to provide resistance. Similarly, the daily 61.8% fib level is at 24.01, expected to provide resistance.
Note the levels of interest below:
- Pivot support is noted at 23.91, 23.73, 23.58
- Pivot resistance is noted at 24.24, 24.39, 24.57
| Levels | Levels.1 |
|---|---|
| Previous Daily High | 24.21 |
| Previous Daily Low | 23.88 |
| Previous Weekly High | 25.92 |
| Previous Weekly Low | 23.74 |
| Previous Monthly High | 26.09 |
| Previous Monthly Low | 23.57 |
| Daily Fibonacci 38.2% | 24.08 |
| Daily Fibonacci 61.8% | 24.01 |
| Daily Pivot Point S1 | 23.91 |
| Daily Pivot Point S2 | 23.73 |
| Daily Pivot Point S3 | 23.58 |
| Daily Pivot Point R1 | 24.24 |
| Daily Pivot Point R2 | 24.39 |
| Daily Pivot Point R3 | 24.57 |
[/s2If]
Nehcap Expert Advisor
The NEHCAP MT4 EA is high quality professional trading system geared to generate returns without using GRID or martingales. Each trade has strict risk per trade parameter. The pairs under management include EURUSD, GBPUSD, AUDCAD, AUDNZD,GBPAUD, EURAUD, EURCAD, CHFJPY and many more.
The system is trading live: LIVE ACCOUNT TRACKING
You can run it free. Apply for a free trial and track our account. Buy the system or use profit share mechanism to generate returns on your MT4.
Join Our Telegram Group


