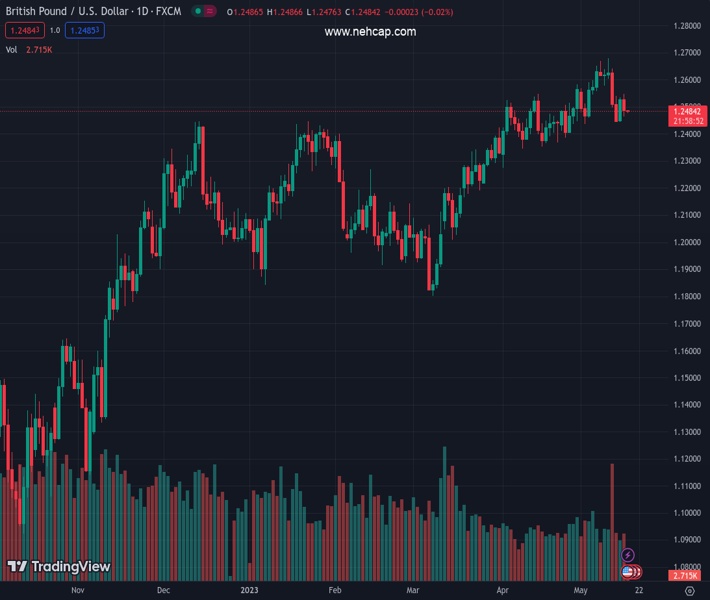
#GBPUSD @ 1.24836 has turned sideways after a sell-off move below 1.2500 as approval for raising the US debt-ceiling limit has been delayed. (Pivot Orderbook analysis)
…
This is a premium post.
[s2If !current_user_can(access_s2member_level4)]Please register for FREE REGISTER to read full post below containing analysis. In case of any error or you think you are not able to read the full post below, please email us at support#nehcap.com [lwa][/s2If] [s2If current_user_can(access_s2member_level1)]
- GBP/USD has turned sideways after a sell-off move below 1.2500 as approval for raising the US debt-ceiling limit has been delayed.
- The Pound Sterling remained in action on Tuesday after the release of the downbeat UK Employment data.
- GBP/USD is at a make or a break level near the lower portion of the Rising Channel chart pattern plotted from 1.2276.
The pair currently trades last at 1.24836.
The previous day high was 1.2535 while the previous day low was 1.2444. The daily 38.2% Fib levels comes at 1.25, expected to provide resistance. Similarly, the daily 61.8% fib level is at 1.2479, expected to provide support.
The GBP/USD pair is demonstrating a sideways auction above 1.2480 after a downside move below the psychological support of 1.2500 in the early Asian session. The Cable witnessed a steep fall after the White House reported that the decision for the approval of a higher US borrowing cap limit has been postponed till the end of the week.
Market mood is expected to remain cautious as each day spent without a concrete decision on the US debt-ceiling is pushing the United States economy into a position of default. The US Dollar Index (DXY) rebounded to near 102.60 as all parties familiar with US debt-ceiling negotiations have admitted disagreement for the approval of a higher US debt-ceiling limit without cutting the spending budget.
The Pound Sterling rebounded sharply on Tuesday after the release of the downbeat United Kingdom Employment data. However, those gains have faded now. Three-month Unemployment Rate jumped to 3.9% vs. the estimates and the former release of 3.8%. Claimant Count Change (April) soared to 46.7K while the street was anticipating a decline of 10.8K. Also, Average Earnings excluding bonuses landed at 6.7%, missing estimates of 6.8%.
GBP/USD is at a make or a break level near the lower portion of the Rising Channel chart pattern plotted from April 03 low at 1.2276. The 50-period Exponential Moving Average (EMA) has restricted the upside of the Pound Sterling.
A confident break of the Relative Strength Index (RSI) (14) below 40.00 will trigger the downside momentum.
A downside move below May 12 low at 1.2440 will trigger a breakdown of the Rising Channel pattern and will expose the Cable to April 21 low at 1.2367 followed by April 03 low at 1.2276.
On the flip side, a recovery move above May 09 high at 1.2640 will drive the major toward the round-level resistance at 1.2700 and 26 April 2022 high at 1.2772.
Technical Levels: Supports and Resistances
GBPUSD currently trading at 1.2482 at the time of writing. Pair opened at 1.2529 and is trading with a change of -0.38 % .
| Overview | Overview.1 | |
|---|---|---|
| 0 | Today last price | 1.2482 |
| 1 | Today Daily Change | -0.0047 |
| 2 | Today Daily Change % | -0.3800 |
| 3 | Today daily open | 1.2529 |
The pair is trading below its 20 Daily moving average @ 1.2513, above its 50 Daily moving average @ 1.2367 , above its 100 Daily moving average @ 1.2254 and above its 200 Daily moving average @ 1.1963
| Trends | Trends.1 | |
|---|---|---|
| 0 | Daily SMA20 | 1.2513 |
| 1 | Daily SMA50 | 1.2367 |
| 2 | Daily SMA100 | 1.2254 |
| 3 | Daily SMA200 | 1.1963 |
The previous day high was 1.2535 while the previous day low was 1.2444. The daily 38.2% Fib levels comes at 1.25, expected to provide resistance. Similarly, the daily 61.8% fib level is at 1.2479, expected to provide support.
Note the levels of interest below:
- Pivot support is noted at 1.247, 1.2412, 1.238
- Pivot resistance is noted at 1.2561, 1.2593, 1.2651
| Levels | Levels.1 |
|---|---|
| Previous Daily High | 1.2535 |
| Previous Daily Low | 1.2444 |
| Previous Weekly High | 1.2680 |
| Previous Weekly Low | 1.2440 |
| Previous Monthly High | 1.2584 |
| Previous Monthly Low | 1.2275 |
| Daily Fibonacci 38.2% | 1.2500 |
| Daily Fibonacci 61.8% | 1.2479 |
| Daily Pivot Point S1 | 1.2470 |
| Daily Pivot Point S2 | 1.2412 |
| Daily Pivot Point S3 | 1.2380 |
| Daily Pivot Point R1 | 1.2561 |
| Daily Pivot Point R2 | 1.2593 |
| Daily Pivot Point R3 | 1.2651 |
[/s2If]
Nehcap Expert Advisor
The NEHCAP MT4 EA is high quality professional trading system geared to generate returns without using GRID or martingales. Each trade has strict risk per trade parameter. The pairs under management include EURUSD, GBPUSD, AUDCAD, AUDNZD,GBPAUD, EURAUD, EURCAD, CHFJPY and many more.
The system is trading live: LIVE ACCOUNT TRACKING
You can run it free. Apply for a free trial and track our account. Buy the system or use profit share mechanism to generate returns on your MT4.
Join Our Telegram Group


