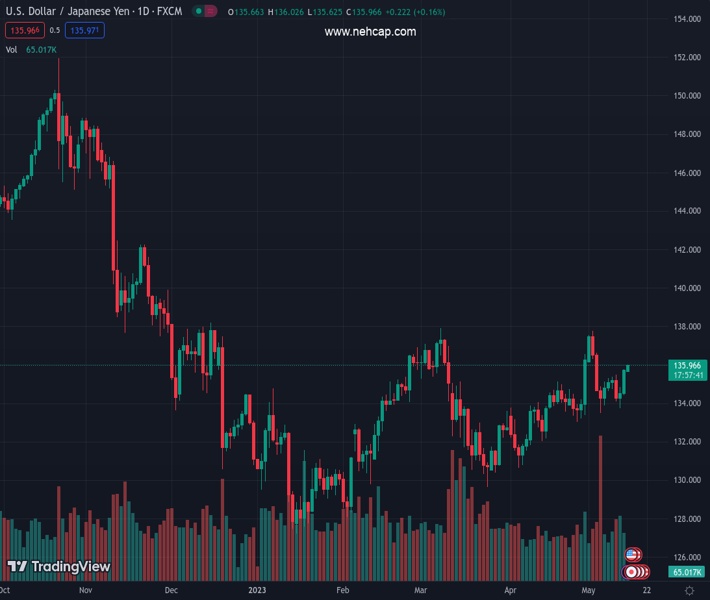
#USDJPY @ 135.973 stays firmer at the highest levels in over a week, prints three-day uptrend., @nehcap view: Limited upside expected (Pivot Orderbook analysis)
…
This is a premium post.
[s2If !current_user_can(access_s2member_level4)]Please register for FREE REGISTER to read full post below containing analysis. In case of any error or you think you are not able to read the full post below, please email us at support#nehcap.com [lwa][/s2If] [s2If current_user_can(access_s2member_level1)]
- USD/JPY stays firmer at the highest levels in over a week, prints three-day uptrend.
- Clear upside break of key moving averages, fortnight-old horizontal resistance favors Yen pair buyers.
- 50-HMA pierces off 200-HMA from below, suggesting further upside of the USD/JPY pair.
- Overbought RSI (14) line, two-week-long horizontal area prod USD/JPY bulls.
The pair currently trades last at 135.973.
The previous day high was 135.77 while the previous day low was 134.4. The daily 38.2% Fib levels comes at 135.24, expected to provide support. Similarly, the daily 61.8% fib level is at 134.92, expected to provide support.
USD/JPY picks up bids to remain firmer around 136.00, printing a three-day uptrend at a one-week high during early Monday.
In doing so, the Yen pair cheers the previous day’s upside break of a horizontal area comprising multiple levels marked since April 28, close to 135.50, as well as a successful upside break of the 200-Hour Moving Average (HMA) level of near 134.90 at the latest.
However, an 11-day-old horizontal resistance zone joins the overbought RSI (14) line and sluggish MACD signals to prod the USD/JPY bulls below the 136.40-45 resistance area.
In a case where the Yen pair buyers ignore the aforementioned negatives to the USD/JPY bulls, the odds of witnessing a rally towards the previous monthly high of around 137.80 and the yearly top marked in March near 137.90, quickly followed by the 138.00 threshold, can’t be ruled out.
Meanwhile, a downside break of the stated HMAs, near 134.90-80, isn’t an open invitation to the USD/JPY bears as an upward-sloping support line from April 26, close to 134.00, may act as the last defense of the buyers.
Overall, USD/JPY may witness further upside but the room towards the north appears limited.
Trend: Limited upside expected
Technical Levels: Supports and Resistances
USDJPY currently trading at 135.97 at the time of writing. Pair opened at 135.72 and is trading with a change of 0.18% % .
| Overview | Overview.1 | |
|---|---|---|
| 0 | Today last price | 135.97 |
| 1 | Today Daily Change | 0.25 |
| 2 | Today Daily Change % | 0.18% |
| 3 | Today daily open | 135.72 |
The pair is trading above its 20 Daily moving average @ 134.81, above its 50 Daily moving average @ 133.76 , above its 100 Daily moving average @ 132.92 and below its 200 Daily moving average @ 137.03
| Trends | Trends.1 | |
|---|---|---|
| 0 | Daily SMA20 | 134.81 |
| 1 | Daily SMA50 | 133.76 |
| 2 | Daily SMA100 | 132.92 |
| 3 | Daily SMA200 | 137.03 |
The previous day high was 135.77 while the previous day low was 134.4. The daily 38.2% Fib levels comes at 135.24, expected to provide support. Similarly, the daily 61.8% fib level is at 134.92, expected to provide support.
Note the levels of interest below:
- Pivot support is noted at 134.82, 133.92, 133.45
- Pivot resistance is noted at 136.19, 136.66, 137.56
| Levels | Levels.1 |
|---|---|
| Previous Daily High | 135.77 |
| Previous Daily Low | 134.40 |
| Previous Weekly High | 135.77 |
| Previous Weekly Low | 133.74 |
| Previous Monthly High | 136.56 |
| Previous Monthly Low | 130.63 |
| Daily Fibonacci 38.2% | 135.24 |
| Daily Fibonacci 61.8% | 134.92 |
| Daily Pivot Point S1 | 134.82 |
| Daily Pivot Point S2 | 133.92 |
| Daily Pivot Point S3 | 133.45 |
| Daily Pivot Point R1 | 136.19 |
| Daily Pivot Point R2 | 136.66 |
| Daily Pivot Point R3 | 137.56 |
[/s2If]
Nehcap Expert Advisor
The NEHCAP MT4 EA is high quality professional trading system geared to generate returns without using GRID or martingales. Each trade has strict risk per trade parameter. The pairs under management include EURUSD, GBPUSD, AUDCAD, AUDNZD,GBPAUD, EURAUD, EURCAD, CHFJPY and many more.
The system is trading live: LIVE ACCOUNT TRACKING
You can run it free. Apply for a free trial and track our account. Buy the system or use profit share mechanism to generate returns on your MT4.
Join Our Telegram Group


