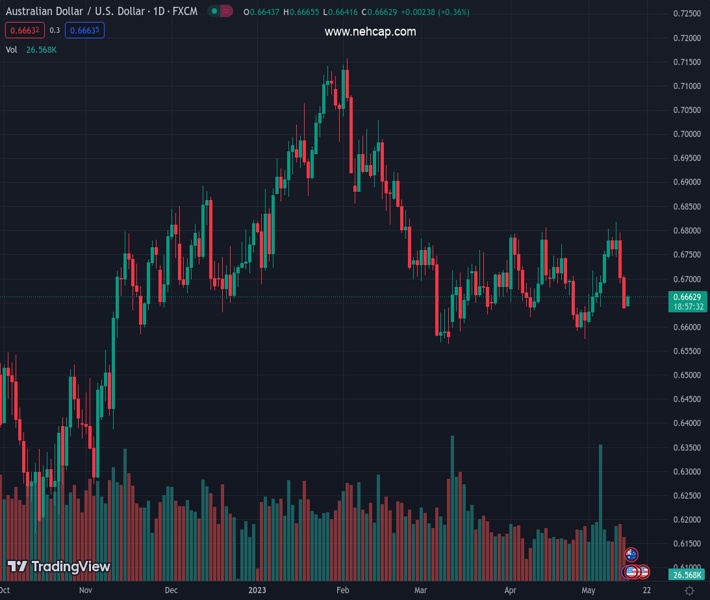
#AUDUSD @ 0.66646 picks up bids to recover from fortnight-old horizontal support to snap two-day downtrend., @nehcap view: Limited recovery expected (Pivot Orderbook analysis)
…
This is a premium post.
[s2If !current_user_can(access_s2member_level4)]Please register for FREE REGISTER to read full post below containing analysis. In case of any error or you think you are not able to read the full post below, please email us at support#nehcap.com [lwa][/s2If] [s2If current_user_can(access_s2member_level1)]
- AUD/USD picks up bids to recover from fortnight-old horizontal support to snap two-day downtrend.
- Short-term resistance line, 200-HMA prod immediate upside even as RSI rebound, bullish MACD signal favor intraday Aussie buyers.
- One-week-long horizontal region act as the last defense of Aussie pair sellers.
The pair currently trades last at 0.66646.
The previous day high was 0.6706 while the previous day low was 0.6636. The daily 38.2% Fib levels comes at 0.6663, expected to provide support. Similarly, the daily 61.8% fib level is at 0.668, expected to provide resistance.
AUD/USD refreshes intraday high near 0.6665 as it bounces off short-term key support to print the first daily gains in three amid early Monday. In doing so, the Aussie pair also justifies the RSI (14) line’s rebound from the oversold territory.
It’s worth noting, that the bullish MACD signals also favor the AUD/USD pair’s U-turn from a two-week-old horizontal support zone surrounding 0.6640.
However, the 61.8% Fibonacci retracement level of the pair’s run-up from April 28 to May 10, close to 0.6670, precedes a downward-sloping resistance line from May 10, near 0.6680 at the latest, to restrict short-term AUD/USD rebound.
Even if the AUD/USD pair rises past 0.6680, the 200-HMA and a horizontal area comprising multiple levels marked since May 05, close to 0.6750, can challenge the buyers before giving them control.
Alternatively, a downside break of the aforementioned horizontal support near 0.6640 won’t hesitate to challenge the late April swing low of around 0.6575.
Following that, the yearly low marked in March around 0.6565 may act as an extra filter towards the south.
Overall, the AUD/USD pair is likely to keep the latest recovery but the upside room appears limited.
Trend: Limited recovery expected
Technical Levels: Supports and Resistances
AUDUSD currently trading at 0.6661 at the time of writing. Pair opened at 0.6644 and is trading with a change of 0.26 % .
| Overview | Overview.1 | |
|---|---|---|
| 0 | Today last price | 0.6661 |
| 1 | Today Daily Change | 0.0017 |
| 2 | Today Daily Change % | 0.2600 |
| 3 | Today daily open | 0.6644 |
The pair remains strongly bearish on the daily time frame. It trades below the 20 SMA @ 0.6691, 50 SMA 0.6683, 100 SMA @ 0.679 and 200 SMA @ 0.6724.
| Trends | Trends.1 | |
|---|---|---|
| 0 | Daily SMA20 | 0.6691 |
| 1 | Daily SMA50 | 0.6683 |
| 2 | Daily SMA100 | 0.6790 |
| 3 | Daily SMA200 | 0.6724 |
The previous day high was 0.6706 while the previous day low was 0.6636. The daily 38.2% Fib levels comes at 0.6663, expected to provide support. Similarly, the daily 61.8% fib level is at 0.668, expected to provide resistance.
Note the levels of interest below:
- Pivot support is noted at 0.6618, 0.6592, 0.6548
- Pivot resistance is noted at 0.6688, 0.6732, 0.6758
| Levels | Levels.1 |
|---|---|
| Previous Daily High | 0.6706 |
| Previous Daily Low | 0.6636 |
| Previous Weekly High | 0.6818 |
| Previous Weekly Low | 0.6636 |
| Previous Monthly High | 0.6806 |
| Previous Monthly Low | 0.6574 |
| Daily Fibonacci 38.2% | 0.6663 |
| Daily Fibonacci 61.8% | 0.6680 |
| Daily Pivot Point S1 | 0.6618 |
| Daily Pivot Point S2 | 0.6592 |
| Daily Pivot Point S3 | 0.6548 |
| Daily Pivot Point R1 | 0.6688 |
| Daily Pivot Point R2 | 0.6732 |
| Daily Pivot Point R3 | 0.6758 |
[/s2If]
Nehcap Expert Advisor
The NEHCAP MT4 EA is high quality professional trading system geared to generate returns without using GRID or martingales. Each trade has strict risk per trade parameter. The pairs under management include EURUSD, GBPUSD, AUDCAD, AUDNZD,GBPAUD, EURAUD, EURCAD, CHFJPY and many more.
The system is trading live: LIVE ACCOUNT TRACKING
You can run it free. Apply for a free trial and track our account. Buy the system or use profit share mechanism to generate returns on your MT4.
Join Our Telegram Group


