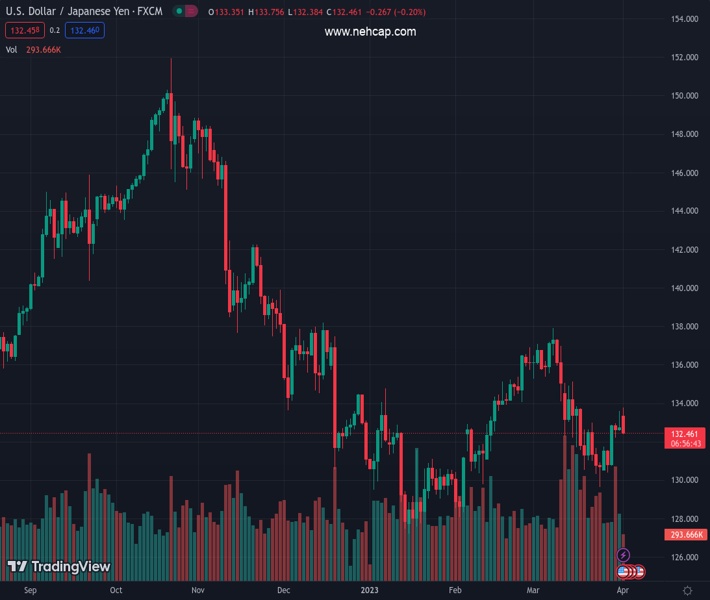
#USDJPY @ 132.533 retreats from over a two-week high touched earlier this Monday. (Pivot Orderbook analysis)
…
This is a premium post.
[s2If !current_user_can(access_s2member_level4)]Please register for PREMIUM VERSION HERE to read full post below containing analysis. In case of any error or you think you are not able to read the full post below, please email us at support#nehcap.com [lwa][/s2If] [s2If current_user_can(access_s2member_level4)]
- USD/JPY retreats from over a two-week high touched earlier this Monday.
- The emergence of fresh selling around the USD exerts downward pressure.
- The 100-day SMA and 50% Fibo. confluence hurdle holds the key for bulls.
The pair currently trades last at 132.533.
The previous day high was 133.6 while the previous day low was 132.59. The daily 38.2% Fib levels comes at 133.21, expected to provide resistance. Similarly, the daily 61.8% fib level is at 132.97, expected to provide resistance.
The USD/JPY pair attracts some sellers after touching over a two-week high on Monday and trades just below the 133.00 round-figure mark during the early North American session.
The US Dollar (USD) struggles to capitalize on its intraday gains amid the uncertainty over the Fed’s rate-hike path, which turns out to be a key factor exerting some downward pressure on the USD/JPY pair. The downside, however, seems limited, at least for the time being, amid a generally positive risk tone, which tends to undermine the traditional safe-haven Japanese Yen (JPY).
From a technical perspective, the USD/JPY pair faces rejection near the 133.75 confluence hurdle, comprising the 50% Fibonacci retracement level of the March downfall and the 100-day Simple Moving Average (SMA). The said area should now act as a pivotal point, which if cleared will set the stage for an extension of the recent move-up witnessed over the past week or so.
That said, oscillators on the daily chart are yet to confirm a bullish outlook, making it prudent to wait for a move beyond the aforementioned barrier before positioning for any further gains. The USD/JPY pair might then aim to surpass the 134.00 round-figure mark and accelerate the momentum towards testing the 61.8% Fibo. level resistance, around the 134.75-134.80 region.
On the flip side, any further slide below the 132.80 area, or the 38.2% Fibo. level, is likely to find decent support near the 132.25 region ahead of the 132.00 mark and the 23.6% Fibo. level, around the 131.60-131.55 zone. A convincing break below the latter could drag the USD/JPY pair below the 131.00 mark, towards the next relevant support near the 130.55-130.50 region.
Technical Levels: Supports and Resistances
USDJPY currently trading at 132.97 at the time of writing. Pair opened at 132.87 and is trading with a change of 0.08 % .
| Overview | Overview.1 | |
|---|---|---|
| 0 | Today last price | 132.97 |
| 1 | Today Daily Change | 0.10 |
| 2 | Today Daily Change % | 0.08 |
| 3 | Today daily open | 132.87 |
The pair is trading below its 20 Daily moving average @ 133.27, above its 50 Daily moving average @ 132.95 , below its 100 Daily moving average @ 133.87 and below its 200 Daily moving average @ 137.32
| Trends | Trends.1 | |
|---|---|---|
| 0 | Daily SMA20 | 133.27 |
| 1 | Daily SMA50 | 132.95 |
| 2 | Daily SMA100 | 133.87 |
| 3 | Daily SMA200 | 137.32 |
The previous day high was 133.6 while the previous day low was 132.59. The daily 38.2% Fib levels comes at 133.21, expected to provide resistance. Similarly, the daily 61.8% fib level is at 132.97, expected to provide resistance.
Note the levels of interest below:
- Pivot support is noted at 132.44, 132.01, 131.43
- Pivot resistance is noted at 133.45, 134.03, 134.46
| Levels | Levels.1 |
|---|---|
| Previous Daily High | 133.60 |
| Previous Daily Low | 132.59 |
| Previous Weekly High | 133.60 |
| Previous Weekly Low | 130.41 |
| Previous Monthly High | 137.91 |
| Previous Monthly Low | 129.64 |
| Daily Fibonacci 38.2% | 133.21 |
| Daily Fibonacci 61.8% | 132.97 |
| Daily Pivot Point S1 | 132.44 |
| Daily Pivot Point S2 | 132.01 |
| Daily Pivot Point S3 | 131.43 |
| Daily Pivot Point R1 | 133.45 |
| Daily Pivot Point R2 | 134.03 |
| Daily Pivot Point R3 | 134.46 |
[/s2If]
Join Our Telegram Group


