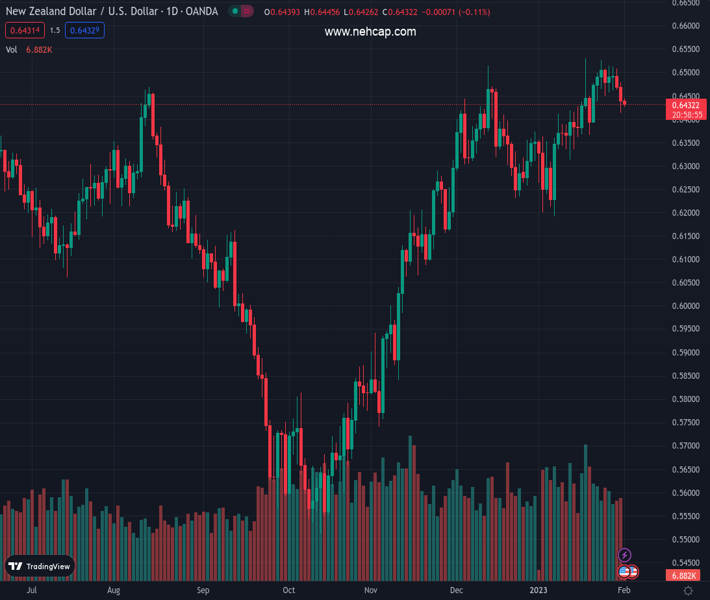
#NZDUSD @ 0.64339 has dropped firmly after sensing deep selling interest while testing the consolidation breakdown. (Pivot Orderbook analysis)
…
This is a premium post.
[s2If !current_user_can(access_s2member_level4)]Please register for PREMIUM VERSION HERE to read full post below containing analysis. In case of any error or you think you are not able to read the full post below, please email us at support#nehcap.com [lwa][/s2If] [s2If current_user_can(access_s2member_level4)]
- NZD/USD has dropped firmly after sensing deep selling interest while testing the consolidation breakdown.
- Investors’ risk-taking capacity is dropping ahead of the interest rate decision by the Fed.
- The 20-EMA has acted as a major barricade for the New Zealand Dollar.
The pair currently trades last at 0.64339.
The previous day high was 0.6479 while the previous day low was 0.6412. The daily 38.2% Fib levels comes at 0.6438, expected to provide resistance. Similarly, the daily 61.8% fib level is at 0.6454, expected to provide resistance.
The NZD/USD pair has resumed its downside journey after a pullback move to near 0.6440 in the Asian session. The kiwi asset is unable to keep up its feet amid the release of lower-than-anticipated New Zealand Employment data. The major has shifted into a negative trajectory as the strength of the cheerful market mood is fading away.
S&P500 futures are facing heat in the Asian session despite a bullish Tuesday ahead of the interest rate decision by the Federal Reserve (Fed), and United States ADP Employment and ISM Manufacturing PMI data. The US Dollar Index (DXY) is looking to build a cushion around 101.70 after a declining move.
NZD/USD has sensed selling interest after testing the strength of the consolidation breakdown in the 0.6450-0.6470 range on a four-hour scale. Earlier, the Kiwi asset shifted into a negative trajectory after delivering a downside break of the Rising Wedge chart pattern, which indicates a bearish reversal after a loss in the upside momentum.
The 20-period Exponential Moving Average (EMA) at 0.6463 has acted as a major barricade for the New Zealand Dollar.
In addition to that, the Relative Strength Index (RSI) (14) has slipped into the bearish range of 20.00-40.00, which conveys an activation of the downside momentum.
For the downside move, a breakdown below January 31 low at 0.6412 will drag the Kiwi asset toward January 17 low at 0.6366 followed by January 12 low around 0.6300.
On the flip side, the asset needs to surpass Wednesday’s high at 0.6530 for a resumption in the upside, which will drive the asset toward June 3 high at 0.6576. A breach of the latter will expose the asset to the round-level resistance at 0.6600.
Technical Levels: Supports and Resistances
NZDUSD currently trading at 0.6432 at the time of writing. Pair opened at 0.6465 and is trading with a change of -0.51 % .
| Overview | Overview.1 | |
|---|---|---|
| 0 | Today last price | 0.6432 |
| 1 | Today Daily Change | -0.0033 |
| 2 | Today Daily Change % | -0.5100 |
| 3 | Today daily open | 0.6465 |
The pair remains strongly bullish on the daily timeframe. It trades above its 20 SMA @ 0.6413, 50 SMA 0.6359, 100 SMA @ 0.6093 and 200 SMA @ 0.6192.
| Trends | Trends.1 | |
|---|---|---|
| 0 | Daily SMA20 | 0.6413 |
| 1 | Daily SMA50 | 0.6359 |
| 2 | Daily SMA100 | 0.6093 |
| 3 | Daily SMA200 | 0.6192 |
The previous day high was 0.6479 while the previous day low was 0.6412. The daily 38.2% Fib levels comes at 0.6438, expected to provide resistance. Similarly, the daily 61.8% fib level is at 0.6454, expected to provide resistance.
Note the levels of interest below:
- Pivot support is noted at 0.6425, 0.6385, 0.6358
- Pivot resistance is noted at 0.6492, 0.6519, 0.6559
| Levels | Levels.1 |
|---|---|
| Previous Daily High | 0.6479 |
| Previous Daily Low | 0.6412 |
| Previous Weekly High | 0.6526 |
| Previous Weekly Low | 0.6437 |
| Previous Monthly High | 0.6531 |
| Previous Monthly Low | 0.6190 |
| Daily Fibonacci 38.2% | 0.6438 |
| Daily Fibonacci 61.8% | 0.6454 |
| Daily Pivot Point S1 | 0.6425 |
| Daily Pivot Point S2 | 0.6385 |
| Daily Pivot Point S3 | 0.6358 |
| Daily Pivot Point R1 | 0.6492 |
| Daily Pivot Point R2 | 0.6519 |
| Daily Pivot Point R3 | 0.6559 |
[/s2If]
Join Our Telegram Group


